ЖУРНАЛ АНАЛИТИЧЕСКОЙ ХИМИИ, 2014, том 69, № 5, с. 529-533
ОРИГИНАЛЬНЫЕ СТАТЬИ =
УДК 543
A NEW SPECTROFLUORIMETRIC METHOD FOR THE DETERMINATION OF URIC ACID IN HUMAN SERUM © 2014 W. W. Bian*, L. Wang**, N. Zhang***, C. Q. Jiang****
*Department of Medical Chemistry, Weifang Medical University Weifang, 261053 P.R. China **State Key Laboratory of Ceramic, Zibo Entry and Exit Inspection and Quarantine Bureau
Zibo, 255000 P.R. China ***Department of Chemistry, Huangshan University Huangshan, 245041 P.R. China ****Department of Chemistry, Shandong Normal University Jinan, 250014 P.R. China Received 06.05.2010; in final form 01.06.2013
A new spectrofluorimetric method is described for the determination of uric acid (UA), that can remarkably reduce the fluorescence intensity of the enoxacin (ENX)-terbium ion (Tb3+) complex at 545 nm. The reduced fluorescence intensity of Tb3+ ion at pH 5.7 is proportional to the concentration of UA. Optimum conditions for the determination of UA have been investigated. The linear range and detection limit for the determination of UA are 6.0 x10⁻⁷—3.0 x 10⁻⁵ M and 1 x 10⁻⁷ M, respectively. The relative standard deviation (RSD) was 0.4% for 6 x 10⁻⁶ M UA (n = 11). The method is simple, practical and relatively free of interferences. It has been successfully applied to assess UA in serum at the level of 3 x 10⁻⁴ M with an RSD of 5—7% (n = 3). The results were evaluated by comparison with a common clinical spectrophotometric method using phosphotungstic acid as developer.
Keywords: enoxacin, spectrofluorimetry, terbium, uric acid.
DOI: 10.7868/S0044450214050028
Uric acid (2,6,8-trihydroxypurine) is the primary product of purine metabolism. The assay of UA in body fluids is a clinically valuable diagnostic indicator. Extreme abnormalities of UA levels are symptoms of such diseases as gout, hyperuricemia and Lesch-Ny-han syndrome. Similarly, elevated UA levels are related to other conditions including increased alcohol consumption, obesity, diabetes, high cholesterol, high blood pressure, kidney disease and heart disease [1].
The most commonly used methods for the determination of UA are phosphotungstic acid [2] and uricase [3] methods. The methods also include capillary electrophoresis [4], high performance liquid chromatography [5], flow-injection [6], electrochemistry [7], and electrochemical microscopy [8]. However, there are no reports on spectrofluorimetric methods for the determination of UA using ENX-Tb3+ as a fluorescent probe.
Enoxacin is an antibiotic containing a-carbonyl carboxylic acid configuration. It is an ideal ligand for Tb3+ ion, as it is suitable for an efficient energy transfer from the ligand to Tb3+ ion and for high fluorescence quantum yield, large Stokes shift, narrow emission
bonds, large fluorescence lifetime and hence no potential background fluorescent emission interferences from the biological matrix [9]. In this work, we chose ENX as the ligand for Tb3+ and investigated the possibility of reducing of the ENX-Tb3+ fluorescence by UA. Experimental results show that the characteristic peak of Tb3+ at 545 nm can be greatly reduced by UA and the reduction in fluorescence intensity is proportional to the concentration of UA. Therefore, a new method with high sensitivity and selectivity for the spectrofluorimetric determination of UA has been established. This method is simple, relatively free of interference from coexisting substances and can be successfully applied to determination of UA in serum samples with satisfactory results.
EXPERIMENTAL
Reagents. All chemicals used were of analytical reagent grade or higher. Doubly distilled demineralized (DDD) water was used for the preparation of all solutions and for all determinations. A stock uric acid (Biological Product Institution of Chinese Medicine) so-
F
100
80
60
40
20
4
7
i
'1 1
Z 3 ^L^ 4
400
500
600 X, nm
,3+ ,
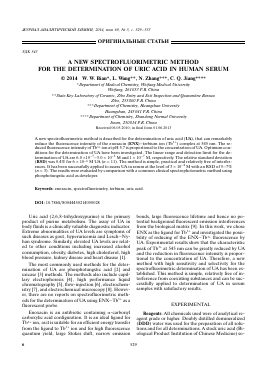
Fig. 1. Fluorescence spectra of ENX (1), Tb3+ (2), UA (3), ENX-Tb3+ (4), ENX—UA (5), Tb3+-UA (6), Tb3+-ENX-UA (7). Experimental conditions: [ENX]: 1.3 x
^ M, pH 5.7
10
6 M, [Tb3+]: 5.0 x 10⁻⁵ M, [UA]: 6 x 10-
(NH4Ac—HAc buffer), XexAem = 335/545 nm.
lution was prepared by dissolving 300 mg Li2CO3 in 200 mL of water, then heating the solution to 60°C, putting 0.504 g UA into the hot Li2CO3 solution and diluting it to 100 mL with water after refrigeration. The working solution (6.0 x 10⁻⁵ M) was obtained by appropriate dilution of the stock solution (6.0 x 10⁻³ M) with water.
A Tb3+ stock solution was prepared by dissolving 4.673 g Tb4O7 (more than 99.99% purity; Shanghai Yuelong Chemical Plant, China) with a small amount of HCl, then diluting to 500 mL with 0.1 M HCl. The working solution (5.0 x 10⁻⁵ M) was obtained by dilution of the stock solution with water.
A stock 8.8 x 10⁻⁴ M solution of enoxacin (Biological Product Institution of Chinese Medicine) was prepared by dissolving 0.1412 g ENX in water and diluting to 500 mL with water. Working standard solution (8.8 x 10⁻⁶ M) was freshly prepared by dilution of the stock solution with water.
Instrumentation.Fluorescence measurements were carried out on an RF-540 recording spectrofluorime-ter (Shimadzu, Kyoto, Japan). A UV-265 recording spectrophotometer (Shimadzu) was used for UV spectra scanning and determination experiments. All pH measurements were made with a pHs—3C digital pH meter (Shanghai Leici Device Works, China).
Operating procedure. A series of solutions with different addition order of reagents but the same concentrations of other reagents, different fluorescence intensities of ENX—Tb3+ complex in the presence of UA (F) and the corresponding blank solutions intensities (without UA, F[0]) were measured at ^ex/^em = 335/545 nm. The decrease in the fluorescence intensity caused by UA was represented as AF = F[0] — F. Adding the reagents in different orders had a negligible influence on the F, F[0] and AF values. Considering the stability of the system and the F, F[0] and AF values, the following order was found optimal: 2.0 mL of 0.10 M NH4Ac—HAc buffer solution (pH 5.7), 1.5 mL of 8.8 x 10⁻⁶ M ENX (final conc. 1.3 x 10⁻⁶ M), 1.0 mL of 5.0 x 10⁻⁴ M Tb3+ (5.0 x 10⁻⁵ M), and 1.0 mL of 6.0 x 10⁻⁵ M UA (6.0 x 10⁻⁶ M). Solutions were added into 10 mL color comparison tubes. The mixture was diluted to 10 mL with water and allowed to stand for 15 min at room temperature, and the fluorescence intensity was measured. The standard curve method was used to determine UA in serum samples.
RESULTS AND DISCUSSION
Fluorescence and absorption spectra. Fluorescence spectra of ENX, Tb3+, UA, ENX-Tb3+, ENX—UA, Tb3+-UA, and ENX—Tb3+—UA are shown in Fig. 1. The Tb3+ solution showed little or no peak, and the characteristic peak of ENX at 545 nm was unclear, too. Under the same conditions, the characteristic peak of ENX—Tb3+ was observed, with two emission peaks at 490 and 545 nm, which correspond to the 5D0—7F1 and 5D0—7F2 transitions of Tb3+, respectively. The peaks indicated that ENX can form a binary complex with ion Tb3+. The fluorescence spectra of ENX—Tb3+—UA system were similar to that of ENX—Tb3+. The fluorescence intensity of ENX—Tb3+ was decreased by UA and the decrease was proportional to the concentration of UA, which indicated that UA reacted with ENX-Tb3+ system and a UA—ENX—Tb3+ ternary complex was formed.
Absorption spectra of ENX, Tb3+, UA, ENX-Tb3+, ENX—UA, Tb3+—UA and ENX—Tb3+—UA are shown in Fig. 2, where we can see that curve 2 has nearly no peak. Comparing curves 1 and 4 in Fig. 2, after the addition of Tb3+ ion into ENX solution, the absorbance enhanced from 0.051 to 0.071, which indicated that ENX can form a binary complex with Tb3+ ion. Comparing curves 4 and 7we can see that the absorbance increased (from 0.071 to 0.176) after the addition of UA into ENX—Tb3+ system, and a red shift occurred (267.0 to 286.0 nm), which indicated that UA reacted with ENX-Tb3+ system forming UA—ENX—Tb3+ ternary complex.
Optimization of reaction conditions. Effect of acidity. A series of solutions with different buffer concen-
4
0
A
0.2
250
300
350
400 X, nm
Fig. 2. Absorption spectra of ENX (1), Tb3+(2), UA (3), ENX-Tb3+(4), ENX-UA (5), Tb3+-UA (6), Tb3+-ENX-UA (7). Experimental conditions see Fig. 1.
F
80
70 60 50 40 30 20 10 0
10 pH
trations but the same concentrations of other reagents and their corresponding blank solutions were measured. The pH of the medium had a significant effect on both the formation of the ENX-Tb3+ complex and the capability of UA to bind to the ENX-Tb3+ complex. The variation in fluorescence intensity of the ENX-Tb3+-UA system with pH is shown in Fig. 3. After adding UA, the AF values reached a maximum and remained constant from pH 5.6 to 5.8. Thus, pH 5.7 was selected with 0.1 M NH4Ac-HAc buffer for further research. Because the addition of 2.0 mL buffer solution caused the fluorescence intensity AF to reach a maximum, this volume was used in the following experiments.
Effect of reaction time. To complete the chelation reaction of the ENX-Tb3+-UA system at room temperature required at least 15 min. The fluorescence intensity remained constant for at least 3 h. Therefore, all chelation reactions were carried out for 15 min, and all measurements were made within 3 h.
Effect of the addition order of reagents. Adding the reagents in different order had a negligible influence on the F, F(0) and AF values. Considering the stability of the system, along with the F, F[0] and AF values, the following order was found optimal: Tb3+, UA, buffer, ENX.
Effect of Tb3+ concentration. Effect of Tb3+ concentration on the decrease in fluorescent intensities AF of the solutions containing 1.3 x 10⁻⁶ M ENX and 6.0 x 10⁻⁶ M UA was studied under the conditions established above. The signal increased with an increase in the amount of Tb3+ up to 1.0 mL (i.e. 5.0 x 10⁻⁵ M) and then decreased until [Tb3+] : [ENX] was equal to
Fig. 3. The influence ofpH on the fluorescence intensity o
Для дальнейшего прочтения статьи необходимо приобрести полный текст. Статьи высылаются в формате PDF на указанную при оплате почту. Время доставки составляет менее 10 минут. Стоимость одной статьи — 150 рублей.