ЭЛЕМЕНТАРНЫЕ ФИЗИКО-ХИМИЧЕСКИЕ ПРОЦЕССЫ
539.1
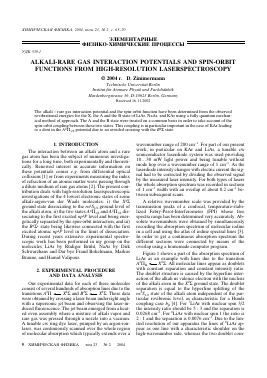
ALKALI-RARE GAS INTERACTION POTENTIALS AND SPIN-ORBIT FUNCTIONS FROM HIGH-RESOLUTION LASERSPECTROSCOPY
© 2004 r. D. Zimmermann
Technische Universität Berlin Institut für Atomare Physik und Fachdidaktik Hardenbergstrasse 36, D-10623 Berlin, Germany Received 16.11.2002
The alkali - rare gas interaction potential and the spin-orbit function have been determined from the observed rovibrational energies for the X, the A and the B state of LiAr, NaAr, and KAr using a fully quantum mechanical method of approach. The A and the B state were treated on a common basis in order to take account of the spin-orbit coupling between these two states. This coupling is in particular important in the case of KAr leading to a dent in the A2n1/2 potential due to an avoided crossing with the B2Z state.
ХИМИЧЕСКАЯ ФИЗИКА, 2004, том 23, № 2, с. 65-70
УДК
1. INTRODUCTION
The interaction between an alkali atom and a rare gas atom has been the subject of numerous investigations for a long time, both experimentally and theoretically. Renewed interest in accurate information on these potentials comes e.g. from differential optical collisions [1] or from experiments measuring the index of refraction of an atomic matter wave passing through a dilute medium of rare gas atoms [2]. The present contribution deals with high-resolution laserspectroscopic investigations of the 4 lowest electronic states of some alkali-argon-van der Waals molecules: i) the XX ground state dissociating to the ns2S1/2 ground level of the alkali atom, ii) the two states A2n1/2 and A2n3/2 dissociating to the first excited np2P level and being energetically separated by the spin-orbit interaction, and iii) the B2X+ state being likewise connected with the first excited atomic np2P level in the limit of dissociation. During recent years extensive experimental spectro-scopic work has been performed in my group on the molecules LiAr by Rüdiger Brühl, NaAr by Dirk Schwarzhans and Dar bye Frand Bokelmann, Markus Braune, and Hamid Valipour.
2. EXPERIMENTAL PROCEDURE
AND DATA ANALYSIS
Our experimental data for each of these molecules
consist of several hundreds of absorption lines due to the transitions A2n -— XX and B2X -— XX. These data
were obtained by crossing a laser beam under right angle
with a supersonic jet beam and observing the laser-induced fluorescence. The jet beam emerged from a heated oven assembly where a mixture of alkali vapor and rare gas was pressed through a nozzle into a vacuum. A tunable cw ring dye laser, pumped by an argon-ionlaser, was continuously scanned over the whole region of molecular absorption which typically extends over a
wavenumber range of 200 cm-1. For part of our present work, in particular on KAr and LiAr, a tunable cw semiconductor laserdiode system was used providing 10...30 mW light power and being tunable without mode hop over a wavenumber range of 1 cm-1. As the laserdiode intensity changes with electric current the signal had to be corrected by dividing the observed signal by the measured laser intensity. For both types of lasers the whole absorption spectrum was recorded in sections of 1 cm-1 width with an overlap of about 0.2 cm-1 between subsequent scans.
A relative wavenumber scale was provided by the transmission peaks of a confocal, temperature-stabilized Fabry-Perot-Interferometer (FPI) whose free spectra range has been determined very accurately. Absolute wavenumbers were obtained by simultaneously recording the absorption spectrum of molecular iodine in a cell and using the atlas of iodine spectral lines [3]. In order to get a continuous absorption spectrum the different sections were connected by means of the overlap using a homemade computer program.
Figure 1 shows a part of the absorption spectrum of LiAr as an example with lines due to the transition A2n0 -— XX. All molecular lines appear as doublets with constant separation and constant intensity ratio. The doublet structure is caused by the hyperfine interaction of the alkali ns valence electron with the nucleus of the alkali atom in the XX ground state. The doublet separation is equal to the hyperfine splitting of the ns2S1/2 state of the alkali atom independent of the particular rovibronic level, as characteristic for a Hunds coupling case bp [4]. For 7LiAr with nuclear spin 3/2 the intensity ratio should be 5 : 3 and the separation is 0.0268 cm-1. For 6LiAr with nuclear spin 1 the ratio is 2 : 1 and the separation is 0.0076 cm-1. Due to the limited resolution of our apparatus the lines of 6LiAr appear as one line with a characteristic shoulder on the high-wavenumber side, whereas the two doublet com-
02(5.5)
60 -
*2i(14.5)
~~l
^2(4.5)
о 40 -
с
3
о U
20 -
Ä2(12.5) ßi(15.5)
i i i i
P2(8.5)
14811.6 14811.8 14812.0
Wavenumber, cm1
Fig. 1. Section of the absorption spectrum of Liar.
7LiAr 7 2 6 1 6 0
6LiAr R1(6.5) 6 0
0
ponents are well resolved in the case of 7LiAr. Therefore, the lines of the two isotopomers being present in natural mixture of isotopes (93% 7Li and 7% 6Li) can easily be distinguished in the spectrum (see Fig. 1). The linewidth of a single doublet component was about 0.008 cm1 and is mainly caused by residual Doppler broadening being due to the angular spread of the jet beam, but has an additional contribution from saturation. A similar doublet splitting was observed for absorption lines of NaAr and KAr, but of course with different separation of the components, e.g. 0.059 cm1 for 23NaAr and 0.0154 cm1 for 39Kar.
In the X state each rovibronic level v, N (N rotational quantum number) splits into two sublevels J = N + 0.5 (e-level) and J = N - 0.5 (/-level) due to spin-rotation coupling. Therefore, 6 rotational branches are expected for each vibrational subband A2n, Q, V — X2E, v". However, spin-rotation splitting in the X state is below resolution of our apparatus leading to a degeneracy of 2 branches with other branches. The 4 remaining branches are labeled P1(J), Q1(J), R1(J) and P12(J) for Q = 1/2 and P2(J), Q2(J), R2(J) and R21(J) for Q = 3/2, where J is the quantum number of total electronic angular momentum of the lower level.
Rotational assignment was accomplished by means of the method of optical-optical double resonance (OODR) using two counterpropagating laser beams interacting with the molecules in the jet beam. The frequency of one laser is fixed and tuned to the maximum of a particular, intense absorption line. The second laser is scanned, e.g. around the frequency of the first laser. For detection we use again the intensity of molecular fluorescence. But now the difference between the intensity when both lasers interact with the molecules and the sum of the intensities when only one of the two la-
sers interacts is recorded. Due to saturation one gets a double resonance signal only, when the scanning laser hits a transition which has a common lower level with the transition being excited by the first laser. The observed double resonance spectra are pretty simple consisting only of 3 or 4 lines per vibrational subband and allowing usually an immediate assignment of rotational quantum numbers. In addition, OODR experiments are very useful in analyzing local perturbations caused by an accidental degeneracy of two rovibronic levels in the system of the upper electronic states A and B.
Vibrational assignment was obtained by use of the isotope relations between Dunham coefficients [5] if two isotopomers are present, as in the case of Li. If only one isotope exists, e.g. for Na, the number of maxima of the spectral distribution of fluorescence allows the determination of v, at least in the A state (see below).
The observed absorption lines were fitte to a Gaussian lineshape and several Gaussians had to be used in case of strong overlapping. The center wavenumbers of the lines could be determined with an accuracy of ±0.001 cm1 on the relative scale and of ±0.003...±0.005 cm1 on the absolute scale, the latter error being mainly due to the accuracy of the iodine absorption lines in the iodine atlas [3]. The observed energy values represent the input data for the determination of the spectroscopic parameters and of the interatomic potentials which will be described in the next sections.
A second source of experimental data comes from the observation of the special distribution of the fluorescence. To this end, a grating monochromatic is inserted in the beam of the detected light. The laser is tuned to a suitable absorption line and the monochromatic is scanned. Figure 2 shows an example for the molecule NaAr, the fluorescence being due to the tran-
Count rate, 1/s
590 600 610 620 630 640 650 660 670 680
Wavelength, nm
Fig. 2. Spectral distribution of fluorescence of NaAr. The laser was tuned to the transition A2n3/2, V = 9, J = 10.5, f ■*-X2X,
v" = 0, J" = 9.5, f at a wavenumber of 16921.464 cm-1 corresponding to a wavelength of 590.97 nm.
sition A2n3/2 —► XX. As the equilibrium distance of A2n is much lower compared with XX the fluorescence is mainly due to bound-free transitions ending on the repulsive part of the XX potential. The experimental curve of Fig. 2 shows a clear reflection structure "reflecting" the vibrational wavefunction of the discrete, upper rovibronic level of the A state, via the Mulliken difference potential into the experimental curve [6]. According to via the Mulliken difference potential into the experimental curve [6]. According to the number of maxima in Fig. 2 we obtain a vibrational quantum number of v = 10 for the A state. The bound-bound transitions are all covered under the first maximum on the low wavenumber side. According to the spectral region of fluorescence of 590 to 680 nm we get information on the repulsive part of the XX state from 0 to 2200 cm-1 corresponding to R values between 2.5 and 4.2 A.
3. SPECTROSCOPIC RESULTS
The center wavenumbers of the absorption lines were fitted to expressions for the energy dif
Для дальнейшего прочтения статьи необходимо приобрести полный текст. Статьи высылаются в формате PDF на указанную при оплате почту. Время доставки составляет менее 10 минут. Стоимость одной статьи — 150 рублей.