УДК 620.179.16
ANALYSIS ON ACOUSTIC SIGNAL CHARACTERISTICS OF THE FATIGUE CRACKS IN ANCHOR STRUCTURE OF CABLE-STAYED BRIDGE TOWER
Sun Guohao1,4, Wang Zhengxing2, Kong Delian3, Bai Mingqing4, Zhou Yang4, Xu Fengjing3, Pan Jiazhen1 1 East China University of Science and Technology, Shanghai, 20023 2 Wuhan Bridge Science Research Institute, Co, Ltd., Wuhan, China, 430034
3 American Physical Acoustic Company, Representitive of Beijing Branch,
100029
4 Research Institute of Dushanzi Petrochemical Company, Co. Ltd.,
Xinjiang, 833600
Abstract: The full size model fatigue test on the anchor structure of cable-stayed bridge tower was engaged in laboratory. The acoustic emission instrument was used to monitor the fatigue cracks continuously in the fillet of the anchorage, to investigate the acoustic signal characteristics. Through different ways of loading, the periodic variation of acoustic signals, and crack propagation parameters of the acoustic signals are obtained. By continuously monitoring of the acoustic signal of the fatigue cracks, it can be possible to find the location of the fatigue cracks, and the time it generates. According the active changes of the acoustic signals of the fatigue crack via continuous monitoring, the propagation tendency of the crack in the anchor structure of the cable-stayed bridge tower can be predicted. This method provides support for the crack detection and on-line real-time monitoring by acoustic emission.
Keywords: tower anchoring structure; fatigue crack; acoustic signal characteristic analysis.
АНАЛИЗ ХАРАКТЕРИСТИК АКУСТИЧЕСКИХ СИГНАЛОВ ОТ УСТАЛОСТНЫХ ТРЕЩИН В ЯКОРНОЙ СТРУКТУРЕ УКРЕПЛЕННОЙ КАБЕЛЯМИ БАШНИ МОСТА
Сун Гуохао1'4, Ван Женъсинъ2, Кот Делянъ3, Бай Минъгинъ4, Жоу Янг4, Ксу Фенъжинъ3, Пан Жиаженъ1 1 Университет науки и технологии восточного Китая, Шанхай, 20023 2 Научно-исследователъский институт в Уханъ Бридж, Уханъ,
Китай, 430034
3 Американская компания физической акустики, представителъство
в подразделении Бейджин, 100029
4 Исследователъский институт петрохимической компании Духанзи,
Ксинъянг, 833600
Построена полная лабораторная модель испытаний на усталость якорной структуры укрепленной кабелями башни моста. Оборудование для акустической эмиссии использовано для непрерывного мониторинга усталостных трещин в углублении якорного крепления, чтобы исследовать характеристики сигналов акустической эмиссии. Путем изменения условий нагрузки была обнаружена периодическая вариация акустических сигналов и получены параметры роста трещин. Если проводить непрерывный мониторинг акустических сигналов усталостных трещин, можно определить положение трещин и момент их возникновения. Проводя непрерывный мониторинг изменений акустических сигналов трещин в якорной структуре укрепленной кабелями башни моста, можно предсказать тенденции роста трещин. Этот метод обеспечивает детектирование трещин с помощью акустической эмиссии и мониторинг в реальном масштабе времени.
Ключевые слова: башня, укрепленная кабелями, усталостная трещина, анализ характеристик акустических сигналов.
1. INTRODUCTION
Currently, the non-destructive testing methods for the bridge structures in service are: survey of the appearance [1, 2], the local area detection [3], static
detection method [4], and the dynamic detection method [3, 5, and 6]. In these tests, the dynamic detection method, compare with other methods, can not be replaced due to the advantages. It is considered to be an effective way to actual working conditions [7]. Domestic and foreign researchers engaged a lot of research work in the dynamic testing of bridge. Some progress has been made. In the dynamic testing of the bridge, acoustic emission detection has been widely used to solve the dynamic testing of the bridge due to its superior advantages [8—11]. A lot of progress has been made [12—16]. But there are still some problems to be solved [17]. Therefore, it is the urgent and important task to engage the application research of the acoustic emission detection in dynamic testing and monitoring to the bridges, to solve the technical problems encountered in testing.
The anchorage structure of the cable-stayed bridge, due to stress concentration, complex structure, is a key parts of the design control. The reliability of the anchor structure is directly related to bridge safety. In order to ensure the safety of anchorage, the researchers of the bridge structure engage variety of studies on anchorage zone of the bridge structure [18—22]. The acoustic emission technology is a useful tool to the detection of fatigue damage, especially suitable for the detection of the bridge.
This paper introduces an investigation on a full size model of anchor structure of a bridge. The acoustic emission technology is used to detect the fatigue crack appeared in the left of the anchor structure. It also investigates the crack signal extraction methods, reference values of parameters, and characteristics of cyclical variation.
Through the positioning of the sound signal of the fatigue cracks, a method is used to determine the time and location of cracks by the changes of the sound signals of cracks, to predict the crack tower anchorage injury, to lay down the foundation of crack detection and monitoring through the real-time acoustic emission for the anchoring structures.
This paper focuses on changes of the loading manner to the signal characteristics, sound source positioning of the fatigue cracks, and the crack propagation tendency inside the tower anchorage according to the activity of fatigue crack characteristics. The method can provide support for the on-line real-time acoustic emission monitoring of the bridge.
2. TEST METHOD AND CONTENT
2.1. Instrumentation
The instrument used in the experiments is SAMOS PCI-8 Acoustic Emission instruments produced by PAC (Physical Acoustic Corp.); the center frequency of resonant sensor is 150 kHz, preamp gain 40 db, the sampling frequency of 1 MSPS (Mega Samples per Second).
2.2. Detection content
There is a highway bridge in China; the main bridge is large span cable-stayed bridge with asymmetric mixed beam. The structure model of the tower anchorage zone in the bridge is shown in Fig. 1. The material of the anchor beam is Q345. The bottom of the anchor beam support connections is using gas protecting welding. The fatigue cycles of the anchor zone structure from the design are 200 million cycles.
The loading manner is compress-compress loading in the test. The maximum load is — 1714 kN. The minimum load is — 124.6 kN. The frequency of the loading is 1.1 Hz. With the increase of the number of fatigue cycles, there is a macro-crack appeared, which is located in the fillet between the bottom support plate and left of the beam of the anchor.
The crack in the tower anchorage is in the Fig. 2. When the fatigue cycles reach 77 million cycles, the acoustic emission monitoring to the fatigue crack was started. The experimental dada of the crack propagation are obtained through 10 days continuously monitoring to the sound signal.
Fig. 1. Test Diagram of beam and loading position.
It can be seen from Fig. 1 that, in the tower anchorage, due to there is fillet weld, lap weld, the space in the welding is in the narrow area, and the quality of welding is affected. The welding is using gas shielded wire welding; the strength of the welding material is higher than the body strength Q235 steel. Due to the stress concentration, larger residual stress in side of the irregular parts is easily to be produced.
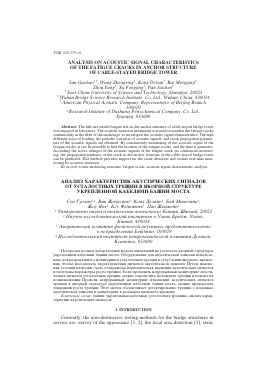
Fig. 2. Position of the crack in the anchorage zone.
The other hand, the beam is non-symmetrical triangle triangular beams. The welding joints of the left beam withstand greater loads. During loading, the center axis of the anchor beam is not overlap with the fatigue test machine. During the process of fatigue testing, both ends of the anchor beam will withstand both bending and torque effects. The welding joints of both ends of anchored beam in the floor support produce composite moments and composite torque, resulting larger stress in the end of the anchor beam. The crack initiated in the bottom of the fillet weld of the beam 1. It is shown in Fig. 2. Due to stress inside of the beam 2 is smaller than beam 1, there is no crack found.
2.3. Acoustic signal attenuation and calibration of speed
Fix two acoustic emission sensors on the tower anchor structure, determine the acoustic signal attenuation value and calibrate the actual speed of the sound
signals in the absence of fatigue load cases. According the locations of acoustic emission sensors can determine the velocity values. The distance between two sensors is 800 mm. Doing lead-off tests away from a specified acoustic emission sensor 100, 200, 600, 700 mm, respectively at three times repeat tests, to measure the distance difference and time difference when the signal reaching the sensor. The calculated speed is between 2.8 and 3.7 m/ms. Compare of the experimental data during the calibration, the sound speed is determined 3.5 m/ms. The attenuation of the sound signal is 20 db at the distance of 800 mm from the sensor.
3. THE RECOGNITION BETWEEN CRACK SIGNAL AND NOISE 3.1. Sensor layout
There are some noise in the test site, mainly from the impact of fuel tanks, metal plastic deformation, squeezed between the metal plate surface friction, and
Fig. 3. The sensor layout to measure the noise signals.
the cyclical shocks produced by metal head load to the top of the triangle beam. Therefore the noise signals must be identified and removed in order to obtain the
Plate 2
30 mm,„
250 mm
100 mm
3
Crack 1
1
Ü4.
60 mm
1
Sensors
11 Sensors 35 mm 5
150
190 mm J
Tf
t
40 mm
400 mm
Fig. 4. Some details to measure the crack signal.
crack signal. Two ways arranged to get the signals of noise and cracks. The arrangement is shown in the Fig. 3 and Fig. 4.
3.2. The recognition of the signals between noise and cracks
By using of software syste
Для дальнейшего прочтения статьи необходимо приобрести полный текст. Статьи высылаются в формате PDF на указанную при оплате почту. Время доставки составляет менее 10 минут. Стоимость одной статьи — 150 рублей.