Pis'ma v ZhETF, vol. 102, iss. 4, pp. 231-234 © 2015 August 25
Anisotropy of the fission fragments from neutron-induced fission in intermediate energy range 1-200 MeV
A. S. Vorobyev+1\ A. M. Gagar,ski+, O. A. Shcherbakov+, L. A. Vaislmene+, A. L. Barabanov* '
+ Konstantinov Petersburg Nuclear Physics Institute, National Research Centre "Kurchatov Institute", 188300 Gatchina, Russia * National Research Centre "Kurcha tov Institute", 123182 Moscow, Russia Moscow Institute of Physics and Technology, 141700 Dolgoprudny, Russia
Submitted 15 June 2015 Resubmitted 10 July 2015
Angular distributions ol fission fragments from the neutron-induced fission of 232Th, 23BU, and 238U have been measured in the energy range 1-200 MeV at the neutron time-of-flight (TOF) spectrometer GNEIS using position sensitive multiwire proportional counters as fission fragment detector. A short description of the experimental equipment and measurement procedure is given. The anisotropy of fission fragments deduced from the data on measured angular distributions is presented in comparison with experimental data of other authors.
DOI: 10.7868/S0370274X1516002X
Angular distributions of fission fragments and cross-sections of nuclear neutron-induced fission are the main source of information about fission barrier structure and nuclear transitional states on the barrier. The relevant experimental data have been accumulated over decades, mostly for En < 20 MeV (En is the energy of incident neutrons). These data are not only of high scientific value, but of great significance for nuclear technologies as well. However, nowadays discussion on accelerator-driven systems (for nuclear power generation and nuclear transmutation) has created considerable interest to nuclear fission at intermediate (En < 200 MeV) and higher neutron energies.
In this paper new experimental data on angular distributions of fragments from fission of target nuclei 232Th, 235U, and 238U by neutrons with energies 1200 MeV are presented. Measurements were carried out at 36 m flight path of a neutron time-of-flight (TOF) spectrometer GNEIS [1] utilizing the PNPI 1 GeV proton synchrocyclotron as a pulsed high-intensity spallation neutron source. Previously, the neutron-induced fission cross sections have been measured at the GNEIS facility for 233U, 235U, 238U, 232Th, 239Pu, 240Pu, 237Np, 243Am, 209Bi, Pb, and W nuclei in the same energy range 1-200 MeV [2, 3] using the parallel plate fission ionization chamber (FIG) clS cl fission fragment detector. Analysis of the experimental data obtained with the FIG has shown the necessity of considering a cor-
-1'e-mail: alexander.vorobyev@pnpi.spb.ru
rection for fragment anisotropy in the calculation of the FIG registration efficiency (the corrections on fragment anisotropy were used in the determination of the 238U/235U fission cross section ratio for En < 1 GeV at the n_TOF facility at CERN [4]).
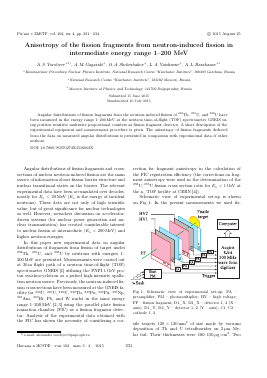
Schematic view of experimental set-up is shown on Fig. 1. In the present measurements we used fis-
y-flash
Fig. 1. Schematic view of experimental set-up: PA -preamplifier; PM - photomultiplier; HV - high voltage; FF - fission fragment; D1_X, D2_X - detector 1, 2 (X -axis); D1_Y, D2_Y - detector 1, 2 (Y - axis); Cl, C2 -cathode 1, 2
sile targets 120 x 120 mm2 of size made by vacuum deposition of Th and U tetrafluorides on 2 ¿tm Mylar foil. Their thicknesses were 100-150yttg/cm2. Two
nucbMa B >K3T® TOM 102 Bbin. 3-4 2015
231
0 0.1 0.2 0.3 0.4 0.5 0.6 0.7 0.8 0.9 1.0 0 0.1 0.2 0.3 0.4 0.5 0.6 0.7 0.8 0.9 1.0
cos(0)
Fig. 2. Example of angular distributions for 232Th. The error bars represent statistical uncertainties. Solid line is a result of the fitting by the function f + b cos2 (0)
coordinates sensitive multiwire proportional counters (MWPC) 140 x 140mm2 of size [5] were used for fission fragment registration. The detectors were placed close to the target in the beam one after the other. The neutron beam diameter at the target position was equal to 75 mm. The neutron beam axis came through the geometrical centers of the target and MWPC's electrodes being perpendicular to them. A value of cos(9), where 9 is an angle between neutron beam axis and fission fragment momentum, can be derived easily from the coordinates of the fission fragment measured with two detectors. Each one of the MWPCs consists of X and Y anodes wire planes made of 25 microns gilded tungsten wires and common cathode located between them. The cathode is made as a square mesh from the same wires. The wire spacing is 1111111 and anode-cathode gaps are about 3 mm. Every two (of 140) neighboring anode wires are connected to the 70 taps of delay line with a specific delay of 2ns/step for coordinate information readout. The timing signals from corresponding ends of the delays carry position information. The coordinates are proportional to the time differences between cathode and anode signals. The two MWPC cathodes were installed at distance of 9 mm from each other, and the cathode of the first MWPC was 6111111 apart from the target. The detectors arrangement used in the present measurements enables to cover the interval 0.3 < cos(9) < 1.0. As it follows from Monte-Carlo simulation, in this range the set-up efficiency is almost constant. The data with cos(9) < 0.3 are much less accurate due to sharp decrease of the registration efficiency. The cathode signals were used as STOP signals for the neutron TOF-spectroscopy, whereas a "bare" photomul-tiplier FEU-30, being installed at the neutron beam 1 111
downstream the MWPC, produced START signal due to registration of a "gamma-flash".
A readout system (Fig. 1) used three outputs from each MPWC which were fed through the fast preamplifiers into 2 waveform digitizers (Acqiris DC-270, 8 bit resolution, 500Ms/s sampling rate). The digitizers were triggered by signals from START photomultiplier for each accelerator pulse. The waveforms were stored on computer hard disk for offline reduction. Time and pulse-height analyses of the waveforms allowed to derive the neutron energy and the fission fragment coordinates on the MWPCs, and, hence, the angle information.
The anisotropy parameters W(0°)/W(90°) of angular distributions of fission fragments in the center-of-mass system were deduced from the data on measured angular distributions in the laboratory system (cos(9) bins were equal to 0.01) by fitting them in the range 0.4 < cos(9) < 1.0 with the expression W(9) ~ 1 + 5cos2(<9), where b = W(0°)/W(90°) - 1. It should be noted that the geometrical acceptance of the experimental set-up is the cos(9) > 0.3 range but the fitting range is the cos(9) > 0.4 range where the set-up efficiency registration is constant and, therefore, the result is not dependent on the efficiency uncertainty, and is not necessary to take into account any additional corrections to the measured angular distribution. To take into account the linear momentum contribution into the measured angular distribution, the anisotropy parameters obtained from the data accumulated with two setup orientations relative to the beam direction (downstream and upstream) have been averaged. Fig. 2 shows angular distributions for 232 Th, averaged over two setup orientation relative to the neutron beam, obtained in neutron energy intervals 6.8 ± 0.2 and 128 ± 12 MeV
ffucbMa b >K3TO tom f02 Bbin. 3-4 2015
Anisotropy of the fission fragments from neutron-induced fission.
233
and the results of their fit. The anisotropy parameters are shown in Figs. 3-5 in comparison with the exper-
10 100 Neutron energy (MeV)
0.1^
Fig. 3. Anisotropy of fission fragments of 232Th: V - [6],
< - [19], A - [11], □ - [7], fission cross-section [9]
[8],
present data,
1
c o
g
c o
1 10 100 Neutron energy (MeV)
Fig. 4. Anisotropy of fission fragments of 23BU: < - [14], A - [11]', 0 - [15], * - [10], □ - [13], o present data, -•— fission cross-section [9]
0.1 ^
V - [12],
- [8], • -
imental data of other authors. The error bars shown include both statistical and systematic errors. The statistical errors were obtained directly from the fitting procedure. The systematical errors were estimated as a difference between anisotropy parameters obtained using two angular ranges for fitting: 0.4 < cos(9) <1.0 and 0.48 < cos(9) < 1.0. A solid line connecting present data points is used solely for convenience of presentation.
It must be admitted that near the fission threshold as well as for lower energies, a contribution of the 4 th Legendre polynomial (or, more simply, of the term ~ cos4(9)) into the fragment angular distribution can be sizable (see, for example, Fig. 3 in [6]). However, at
1
c o ■-P a u
o Ö o
10 100 Neutron energy (MeV)
0.1 s
Fig. 5. Anisotropy of fission fragments of 238U: V - [12], < - [14], > - [16], A - [11], 0 - [17], * - [18], □ - [7], o -[8], • - present data, -•— fission cross-section [9]
higher energies only the 2 nd polynomial is of significance (see Fig. 2). Since this work is mainly dedicated to the high energies, we used only the term ^cos2(9) for fitting the data. Thus, in principle, there exists some additional uncertainty for anisotropy parameter in the narrow energy range near the fission threshold and below. Nevertheless, even in this range, En = (1—2) MeV, as it follows from Fig. 3, there is an agreement (within the experimental uncertainties) of our data for 232Th and the data by Tarrio et al. [6] obtained with an account for the 4 th Legendre polynomial.
Turning to the discussion of the obtained results, we note that until recently in the energy range 20100 MeV only the data by Ryzhov et al. [7] on the angular anisotropy of fission fragments for 232Th and 238U isotopes existed, while there were no data for neutron-induced fission of 235U. It is also of interest that a significant difference in fission fragment angular anisotropy was observed for 232 Th and 238U isotopes with the use of quasi-monochromatic neutron source [7]. The TOF spectromete
Для дальнейшего прочтения статьи необходимо приобрести полный текст. Статьи высылаются в формате PDF на указанную при оплате почту. Время доставки составляет менее 10 минут. Стоимость одной статьи — 150 рублей.