ХИМИЧЕСКАЯ ФИЗИКА, 2004, том 23, № 2, с. 32-35
ЭЛЕМЕНТАРНЫЕ ^^^^^^^^
ФИЗИКО-ХИМИЧЕСКИЕ ПРОЦЕССЫ
УДК 539.196.3
DIRECT OBSERVATION OF THE GEOMETRY OF Na + MOLECULE COLLISION PAIRS
© 2004 r. R. Goldstein*, J. Grosser*, O. Hoffmann*, F. Rebentrost**
* Institut für Atom- und Molekülphysik, Universität Hannover 30167 Hannover, Germany **Max-Planck-Institut für Quantenoptik, 85748 Garching, Germany Received 16.11.2002
The electronic structure of the Na-Ne, Na-N2 and Na-C2H2 collision pairs is probed by optical excitation. Based on polarization experiments, we measure the alignment tensor of the electronic transition dipole moments. We compare the experimental data with the results of quantum chemical and dynamical calculations. The different geometric properties of the electronic wave functions of the collision pairs are directly visible in the experimental data.
1. INTRODUCTION
The aim of the work presented is to get information about the electronic wave function of the collisional complex Na-X, X = Ne, N2 or C2H2. For this purpose, we investigate optical collisions
Na(3s) + X + hv — Na(3p) + X (1)
in which a Na(3s) atom collides with another particle X = Ne, N2, C2H2 in the presence of photons with energy hv. The wavelength of the excitation laser is detuned relative to the free sodium transition from Na(3s) to Na(3p). Therefore, excitation is only possible during the collision. In our experiments we vary the polarization of the excitation laser and measure the yield of Na(3p) atoms depending on the polarization. Thus we can make visible the considerable differences of the electronic structures of Na-Ne, Na-N2 and Na-C2H2. We also give an explanation of our experimental findings based on quantum chemical calculated electronic transition dipole moments and potential surfaces and on classical trajectory calculations.
2. THE EXPERIMENT
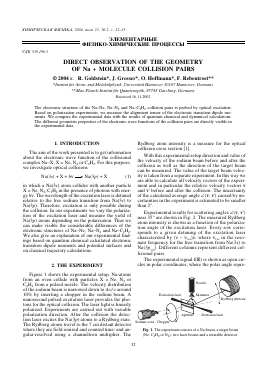
Figure 1 shows the experimental setup. Na-atoms from an oven collide with particles X = Ne, N2 or C2H2 from a pulsed nozzle. The velocity distribution of the sodium beam is narrowed down to A v/v around 10% by inserting a chopper in the sodium beam. A nanosecond pulsed excitation laser provides the photons for the optical collision. The laser light is linearly polarized. Experiments are carried out with variable polarization direction. After the collision the detection laser excites the Na(3p) atoms to a Rydberg state. The Rydberg atoms travel to the 7 cm distant detector where they are field ionized and counted time- and angular-resolved using a channeltron multiplier. The
Rydberg atom intensity is a measure for the optical collision cross section [1].
With this experimental setup direction and value of the velocity of the sodium beam before and after the collision as well as the direction of the target beam can be measured. The value of the target beam velocity is taken from a separate experiment. In this way we are able to calculate all velocity vectors of the experiment and in particular the relative velocity vectors v and v' before and after the collision. The uncertainty of the calculated average angle Z(v, v') caused by uncertainties in the experiment is estimated to be smaller than 2°.
Experimental results for scattering angles Z(v, v') near 35° are shown in Fig. 2. The measured Rydberg atom intensity is shown as a function of the polarization angle of the excitation laser. Every row corresponds to a given detuning of the excitation laser characterized by (v - vres)/c where vres in the resonant frequency for the free transition from Na(3s) to Na(3p1/2). Different columns represent different collisional pairs.
The experimental signal I(E) is shown as open circles in polar coordinates, where the polar angle repre-
Fig. 1. The experiment consist of a Na-beam, a target beam (Ne, C2H2 or N2), two laser beams and a rotatable detector.
DIRECT OBSERVATION OF THE GEOMETRY OF Na + MOLECULE COLLISION PAIRS
33
Detuning Na-Ne
Na-N2
Na-C2H2 Detuning Na-Ne
Na-N2 Na-C2H2
120 cm-
240 cm-
[O \ o\ o o
:
£ pn( Edn )2 = EAE,
(2)
120 cm-
240 cm-
Fig. 2. The variation of the optical collision signal with the polarization of the excitation laser for 35° scattering angle. Theoretical (dashed lines) and experimental results (open circles) are shown together with the result of a fit to the experimental data (full lines) in polar coordinates for different detunings of the excitation laser and different collision pairs. The polar angle gives the direction of the polarization of the excitation laser. The bars represent the main axes of the alignment tensor. The arrows show the relative velocity vectors before and after the collision.
sents the polarization detection of the incident light. The full lines through the data points are the result of a least squares fit. The full bars show the directions of the polarization for maximum and minimum signal intensity respectively and give the signal intensity for these conditions. The arrows in each box represent the directions of the relative velocities; the left one shows v and the right one v'. The dashed lines give the results of calculations.
In Fig. 3 more experimental results for scattering angles Z(v, v') near 40° are shown. The experiments shown here are preliminary because the uncertainty of the average angle Z(v, v') in this measurements is larger then in the experiments shown in Fig. 2 [2]. In view of this the results shown in Fig. 3 are only used for a qualitative discussion.
3. DISCUSSION
The yield of Rydberg atoms in our experiment is proportional to the transition probability for the optical collision. For a given excitation light field with the electric field vector E and a collision pair with the electronic transition dipole moment d this transition probability is proportional to (Ed)2. This describes the process in total only if there is just one way of excitation. If there is more then one way all possible transition probabilities multiplied with a weighting factor pn have to be summed up to get the signal I. This can be transformed in the form
360 cm-
480 cm-
o o
0
(!) vD
Fig. 3. The variation of the optical collision signal with the polarization of the excitation laser for 40° scattering angle. Experimental results (open circles) are shown together with the result of a fit to the experimental data (full lines) in polar coordinates for different detunings of the excitation laser and different collision pairs. The polar angle gives the direction of the polarization of the excitation laser. The bars represent the main axes of the alignment tensor. The arrows show the relative velocity vectors before and after the collision.
where A is the alignment tensor [3]. It contains information about the electronic transition dipole moment of the collisional pair. Interference between different trajectories is not accounted for by this formula. This is a reasonable simplification for the atom-molecule experiments because interference is not resolved. The main reason is that the experimental data give an average over collisions with all possible orientations of the molecule relative to the line connecting the atom and the molecule. For atom-atom collisions different orientation of the collision partners relative to the connecting line do not exist and interferences are resolved [4]. But also in these cases Eq. (2) is in good agreement with quantum calculations for the angle amax of the largest principal axes of the alignment tensor relative to the relative velocity of the collisional complex apart from the region of the minima in the differential optical collision cross section [5]. The measurements discussed here were carried out in the region of the maxima. The bars in Figs. 2 and 3 give the principal axes of the alignment tensor up to an arbitrary factor. So we can determine
n
3 XHMH^ECKAH ÎH3HKA tom 23 < 2 2004
34
GOLDSTEIN et al.
20
10
NaC2H
-10
-20 20
s/p
7 / ! ^ V
/ / I \ N
A_l_
NaN2 \
'l''/' ïm'I1 /
I. I I ! I r .1 ,1
2A'
\V\\ \!/ /'/V/7
. W \ V / i/y/
20
Fig. 4. Calculated transition dipole moments for the collision pairs Na-C2H2 and Na-N2 are shown as bars. Position and alignment of the molecules are indicated by the full circles. The inner line marks the surface where excitation can occur for the detuning 480 cm-1 and the outer line is the
same for 120 cm 1 [6]
from our experimental data the angle amax and the contrast k which is given by
k =
A n-A
22
A11+ A
(3)
22
with eigenvalues A11 and A22 of the alignment tensor and An > A22.
For a more intuitive understanding of the collisions in Fig. 4 [6] the electronic transition dipole moments are visualized as bars for the collisional complexes Na-C2H2 and Na-N2. Taking the alignment of those
bars as the alignment of the Na(3p) orbital during the collision gives a good illustrative picture. The points in the middle of the figure show the alignment and position of the molecule. The thin lines give the boundaries of the area where the excitation can occur for the detunings of the excitation laser used here. The inner line marks the surface where excitation can occur for the largest detuning and the outer line is the same for the smallest detuning.
For Na-N2 all transition dipole moments are approximately parallel to the line connecting the collision partners in the area where excitation occurs for the investigated optical collisions. This means that in the moment of excitation there are always E-like states for this complex for all explored cases. The transition dipole moments for Na-Ne look similar to those of Na-N2 in the region of interest. For the complex Na-C2H2 it looks similar for the largest detuning used. For smaller detunings and polar orientations of the molecule the transition dipole moments are perpendicular to the line connecting the collision partners. They correspond to n-like states of the complex caused by a conical intersection in the potential surfaces. This striking difference in the distri
Для дальнейшего прочтения статьи необходимо приобрести полный текст. Статьи высылаются в формате PDF на указанную при оплате почту. Время доставки составляет менее 10 минут. Стоимость одной статьи — 150 рублей.