ЖУРНАЛ АНАЛИТИЧЕСКОЙ ХИМИИ, 2014, том 69, № 3, с. 260-264
ОРИГИНАЛЬНЫЕ СТАТЬИ
УДК 543
DISPERSIVE LIQUID-LIQUID MICROEXTRACTION OF Fe(II) AND Cu(II)
WITH DIETHYLDITHIOCARBAMATE AND THEIR SIMULTANEOUS SPECTROPHOTOMETRIC DETERMINATION USING MEAN CENTERING
OF RATIO SPECTRA © 2014 M. Arvand*, E. Bozorgzadeh*, M. A. Zanjanchi*, Sh. Shariati**
*Department of Chemistry, Faculty of Science, University of Guilan Namjoo street, P.O. Box: 1914, Rasht, Iran **Department of Chemistry, Science and Research Branch, Islamic Azad University
Guilan, Iran Received 16.08.2011; in final form 13.05.2013
A new dispersive liquid—liquid microextraction (DLLME) method for preconcentration of trace quantities of Fe(II) and Cu(II) followed by their spectrophotometric determination has been developed. For the extraction, an appropriate mixture of ethanol (the disperser solvent) and carbon tetrachloride (the extraction solvent) was injected rapidly into the water sample containing Fe(II) and Cu(II) after formation of complexes with di-ethyldithiocarbamate. Mean centering (MC) of ratio spectra has been used for simultaneous determination of Fe(II) and Cu(II). Linear range of the method is 1.0-100 ng/mL for Fe(II) and 0.3-100 ng/mL for Cu(II), the detection limit is 0.53 and 0.14 ng/mL Cu(II), resp. The interference effect of some anions and cations is reported. The method was applied to the determination of Fe(II) and Cu(II) in well water samples.
Keywords: dispersive liquid-liquid microextraction, spectrophotometry, heavy metals, mean centering.
DOI: 10.7868/S0044450214030025
The determination of trace amounts of heavy metals is becoming increasingly important because of they may accumulate to toxic concentration levels thus leading to ecological damage [1, 2]. For example, iron and copper content is very important in the environmental and biogeochemical studies [3]. Accurate and reliable analytical methods possessing high sensitivity and selectivity coupled with convenience and economy for the determination of heavy metals are required.
In many previous studies electroanalytical methods [4], atomic absorption spectrometry [5], and chromatography [6] have been used for the determination of these metals. For various matrices, inductively coupled plasma-mass spectrometry analysis (ICP-MS) [7] is a method of choice for the determination of the heavy metals at trace levels because of such advantages as ability to simultaneous multi element deterction, high sensitivity and ease of coupling with other analytical techniques. However, preconcentration and matrix elimination is usually required for the determination of low concentrations of the metal ions in environmental samples. Nowadays, various preconcentration and separation methods such as solid phase extraction, single drop microextraction (SDME), cloud point extraction (CPE), liquid-phase microextraction
(LPME), and dispersive liquid—liquid microextraction (DLLME) have been developed.
DLLME exhibits high performance such as simple, rapid, inexpensive as well as high concentrating ability and low consumption of organic reagents, most importantly, suitable for batch analysis [8]. This method uses an extracting solvent dissolved in a dispersive solvent, which is miscible with both extraction solvent and water. Methanol, acetone, acetonitrile, etc., have been used as dispersive solvents.
There are many methods for the simultaneous (spectrohotometric) determination of analytes which are free from bias, e.g. H-point standard addition method (HPSAM) and P-correction absorbance [9]. The HPSAM approach developed by Falco et al. requires several standard addition samples. The responses are collected in two selected wavelengths so that blank absorptivity is the same in both wavelengths. The difference of absorbance (absorbance increment) in these wavelengths (AA) will cancel the contribution of the reagent blank. The disadvantage of HPSAM is its need for standard addition for every sample. Also using the absorbance increment instead of one wavelength absorbance one loses some of the method's sensitivity. The P-correction absorbance method developed by Gao uses some mathematical equations to
give correct responses. This method also uses only a couple of wavelengths for calculations.
More recently, Afkhami et al. have presented new approach for simultaneous analysis of binary and ternary mixtures entitled mean centering of ratio spectra [10, 11]. The theory of this technique is briefly presented below.
Consider a mixture of two compounds X, and Y. If there is no interaction among the compounds and Beer's low is obeyed for each compound, it can be written:
Am = aXCX + aYCY, (!)
where Am is the vector of the absorbance of the mixture, aX and aY are the molar absorptivity vectors of X and Y and CX and CY are the concentrations of X and Y, respectively.
If Eq. (1) is divided by aY corresponding to the spectrum of a standard solution ofY in binary mixture, the rst ratio spectrum is obtained in the form of Eq. (2) (for possibility of dividing operation, the zero values of aY should not be used in the divisor):
B =
a XCX
+ C Y
(2)
a Y a Y
If the Eq. (2) is mean centered (MC), since the mean centering of a constant (CY) is zero, Eq. (3) will be obtained:
MC(B) = MC
a X CX
a Y _
(3)
Eq. (3) permits the determination of concentration of each of the active compounds in the solution (X in this equation) without interfering from the other compound of the binary system (Y in these equations). As Eq. (3) shows there is a linear relation between the amount of MC(fi) and the concentration of X in the solution. A calibration curve could be constructed by plotting MC(5) against concentration ofX in the standard solutions of X or in the standard binary mixtures. For more sensitivity the amount of MC(fi) corresponding to maximum or minimum wavelength should be measured. Calibration graphs for Y could also be constructed as described for X [12].
In this work, we developed the method of precon-centration and determination of Cu2+ and Fe2+ using dispersive liquid—liquid microextraction followed by spectrophotometry analysis. Mean centering of ratio spectra was used for simultaneous determination of analytes.
EXPERIMENTAL
All reagents were of analytical reagent grade and used without further purification. Triply distilled water was used throughout the study. A stock solution (1000 ^g/mL) of Fe(II) and Cu(II) were prepared
by dissolving Fe(NH4)2(SO4)2 • 6H2O (Merck) and Cu(NO3)2 • H2O (Merck), respectively. A stock solution of diethyldithiocarbamate (DDC) (0.025 M) was prepared by dissolving sodium diethyldithiocarbamate (Merck) in ethanol (Merck). All of the solutions were prepared fresh daily. Acetate buffer solution of pH 5.5 was prepared from 0.5 M acetic acid and 0.5 M sodium acetate solutions.
UV-Vis absorbance digitized spectra were collected on a Shimadzu UV-2100 spectrophotometer, using a 1 cm quartz cell. Measurements of pH were made with a Metrohm 744 pH-meter using a combined glass electrode. A centrifuge with 10-mL calibrated tubes (Superior, Germany) was used to accelerate the phase separation process. All calculations in the computing process were done in Matlab 6.5 and Microsoft Excel for Windows.
For DLLME under optimum conditions, 10.0 mL of sample solution containing the analytes and DDC (1.6 x 10⁻⁶ M) were adjusted to pH 5.5 in a glass test tube with conic bottom. Then the injection of0.500 mL ethanol (disperser solvent) containing 200 ^L carbon tetrachloride (extraction solvent) was performed by using 1.0 mL syringe, rapidly. A cloudy solution (water, ethanol and carbon tetrachloride) was formed in a test tube. The produced cloudy solution was centri-fuged for 5 min at 3000 rpm. After this process sedi-mented phase was removed using a 250.0 ^L syringe and injected into a micro-cell. Subsequently, the micro-cell was located in spectrophotometer to obtain related spectra.
RESULTS AND DISCUSSION
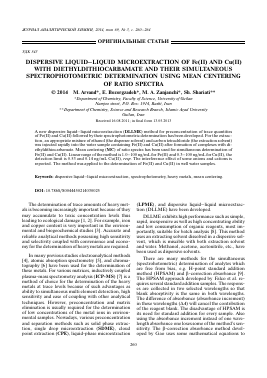
Diethyldithiocarbamate is frequently used as a photometric reagent for Fe(II) and Cu(II). This reagent does not absorb light in the visible range. The absorption spectra of its complexes with Fe(II) and Cu(II) are shown in Fig. 1. As can be seen, the spectra of the complexes overlap severely throughout the wavelength range and therefore each compound interferes in the spectrophotometric determination of the other. But simultaneous determination of Fe(II) and Cu(II) is possible by using mean centering of ratio profiles.
Effect of type and volume of extraction solvent. The
selection of an appropriate solvent is very important for the DLLME. The solvent should have extraction capability regarding compounds of interest, be more dense than water, and have low solubility in water. Dichloromethane, carbon tetrachloride, chloroform were selected as candidates. A series of sample solutions were studied by using 500 ^L of ethanol contains different volumes ofextraction solvent to achieve a steady of sedimented phase. Thereby, 250, 200 and 250 ^L of dichloromethane, carbon tetrachloride and chloroform were used, respectively. The results indicated when chloroform was used as extraction solvent, an
Wavelength, nm
Fig. 1. The absorption spectra of (a) 5.0 ng/mL Cu(II), and (b) 5.0 ng/mL Fe(II) at pH 5.5 after extraction with DDC.
unstable cloudy solution forms. Carbon tetrachloride has higher extraction efficiency than dichloromethane. Therefore, carbon tetrachloride was chosen for the experiments.
In order to examine the effect of the extraction solvent volume, solutions containing different volume of carbon tetrachloride (100, 120, 150, 200, 250 ^L) were subjected to the same DLLME procedure. It was expected that increasing amount of volume of the extraction solvent causes an increase in absorbance because increasing amount of volume of the extraction solvent caused an increase in extraction efficiency. At larger extractant volumes, the absorbance decreased. This is due to the fact
Для дальнейшего прочтения статьи необходимо приобрести полный текст. Статьи высылаются в формате PDF на указанную при оплате почту. Время доставки составляет менее 10 минут. Стоимость одной статьи — 150 рублей.