ПРИБОРЫ И ТЕХНИКА ЭКСПЕРИМЕНТА, 2014, № 2, с. 131-134
ФИЗИЧЕСКИЕ ПРИБОРЫ ДЛЯ ЭКОЛОГИИ, МЕДИЦИНЫ, БИОЛОГИИ
EVALUATING IMAGE RECONSTRUCTION METHODS IN IMPROVING EFFECTIVE PARAMETERS ON IMAGE QUALITY IN IRI-MICRO PET
© 2014 t. S. Z. Islami rad*, M. Shamsaei Zafarghandi*, R. Gholipour Peyvandi**, M. Ghannadi Maragheh**
*Nuclear Engineering and Physics Department, Amirkabir University P.O. Box: 15875-4413, Tehran, Iran E-mail: pysham@yahoo.com **Nuclear Science and Technology Research Institute AEOI, P.O. Box: 14155-1339, Tehran, Iran Received July 8, 2013
We intend to improve the image reconstruction for RMS contrast, spatial resolution and signal-to-noise (SNR) parameters for the animal positron emission tomograph IRI-microPET (IRI — Islamic Republic of Iran), designed and built at the Gamma scan laboratory of nuclear science and technology research institute. Acquired images quality from this system depends on different algorithms for image reconstruction in addition to its design and construction. In this paper, system features and tomography method are considered, firstly. Then, image reconstruction algorithms (MLEM, SART and FBP) were performed on sinogarm. Acquired images quality from these reconstructed algorithms was compared with RMS contrast, spatial resolution and SNR characteristics. Also, reconstructed time and speed of process for three algorithms was considered. According to results, obtained RMS contrast, spatial resolution and signal to noise ratio (SNR) from reconstructed images with MLEM algorithm shows superiority of MLEM algorithm against the SART and FBP algorithms but its computation time is high. Thus, SART algorithm can be suitable replacement for MLEM algorithm.
DOI: 10.7868/S0032816214020177
1. INTRODUCTION
Positron emission tomography (PET) instrument is motivated by the need to perform non-invasive studies of small animal models of metabolism, disease mechanisms and physiological processes for potential human application. Animals such as mice are often used to determine a number of important variables such as organ or tumor-specific uptake, maximum allowable pharmaceutical dose, and the kinetics of tracer uptake and washout for various organs and tumors. Therefore PET in small animal imaging has been used and is a helpful instrument for drug development, the imaging of gene expression, the monitoring of gene therapy, and the development of new animal models [1—7].
The small size of this animal produces serious requirements for accurate imaging. Thus effective parameters on image quality as spatial resolution, RMS contrast and SNR should be improved using different algorithms for image reconstruction. Recent development of image reconstruction algorithms attempts to improve image quality.
J.Ch. Cheng et al. present an evaluation of the quantitative accuracy of the 3D maximum a posteriori (3D-MAP) image reconstruction algorithm for dynamic PET imaging with comparisons to two of the
most widely used reconstruction algorithms: the 2D filtered-back projection (2D-FBP) and 2D-ordered subsets expectation maximization (2D-OSEM) on the Siemens micro PET scanners. The authors observed that 3D-MAP produces more accurate activity concentration estimates than 2D-FBP or 2D-OSEM at all practical levels of statistics and contrasts due to improved spatial resolution leading to lesser partial volume effect [8].
C. Lartizien et al. demonstrated that the FORE_AWOSEM algorithm led to the best overall detection and localization performance for lcm-diame-ter targets compared with the FORE_OSEM and FORE_FBP algorithms [9].
Hongqing Zhu et al. have investigated a new iterative algorithm for penalized-likelihood image reconstruction that uses the fuzzy nonlinear anisotropic diffusion as a penalty function. Quantitative analysis shows that the proposed reconstruction algorithm is suitable to produce better reconstructed images when compared with ML-EM, OS-EM, Gaussian-MAP, MRP, TV-EM reconstructed images [10].
In previous works [8—11], SART algorithm was not considered and compared with other reconstruction algorithms and comparison only were limited to one or two parameters. But in this research, we present a
131
9*
132
ISLAMI RAD h gp.
comparison of 3 image reconstruction algorithms (FBP, MLEM and SART) for improving of effective parameters on images quality such as spatial resolution, RMS contrast and signal to noise ratio (SNR). Also, reconstruction time using these algorithms was measured to estimate reconstruction speed.
2. THEORY
Acquired sinograms should be reconstructed using reconstruction methods that are divided into two main categories: analytic and iterative. Image reconstruction has been performed with analytical algorithms based on the filtered back projecion (FBP) method. FBP is based on direct computation of the inverse Radon transformation that combines collected data with image pixels values and has an immediate mathematical solution for image formation. But the drawbacks of FBP methods is streak artifacts and low signal to noise (SNR) due to neglecting of different factors affecting image quality for PET system, especially. These factors are detector characteristic, positron range, random statistics, scatter and etc. Therefore, iterative image reconstruction techniques have been proposed which are classified to algebraic and statistical algorithms.
Maximum likelihood algorithm is statistic reconstruction method that uses characteristic of data Poisson statistics, and in every iteration step it tries to maximize the log-likelihood. The iterative method benefits consist of good spatial resolution and contrast, low noise. But slow computation time of this algorithm persuades us to propose other iterative algorithm.
Algebraic reconstruction technique (ART) relay on the assumption that projection data are connected linearly to image pixels. This method appears to require a long time for convergence and thus takes a long time for reconstructing an image. For this reason SART or simultaneous ART was proposed. Simultaneous algebraic technique (SART) is an algebraic method where all image pixels are updated simultaneously using all projection data [12—17]. After performing of reconstruction algorithms, we evaluate image quality using RMS contrast, spatial resolution and signal to noise parameters.
2.1. RMS contrast
The RMS contrast in each image demonstrates the effect of following factors on image quality. In the reconstructed image, contrast is a criterion which shows the color diversity of images and the difference in visual properties that makes an object (or its representation in an image) distinguishable from other objects and the background. There are several definites for calculating contrast. In this paper, RMS contrast was selected to compare image qualities. RMS contrast is defined as the standard deviation of the pixel intensities.
RMS contrast =
N - 1 M - 1
MN
EE I -1)2
where intensities Iy are the i-th and j-th elements of
the two dimensional image of size Mby N; I is the average intensity of all pixel values in the image. The pixels of image I are normalized to have intensity value in the range of (0, 1). For comparing between all reconstructed images, all reconstructed images of energy windows are normalized to intensity range that have most value, in the other words (0, 1) for normalization are related to one window which has most variety in color spectrum [18—19].
2.2. Spatial resolution
Spatial resolution is determined by measuring the width of the profile obtained when an object much smaller than the expected resolution of the system is imaged. The spatial resolution was calculated as the full width at half maximum (FWHM) of the profiles [19-22].
2.3. Signal to Noise (SNR)
Typically the signal is defined as the difference between an object and its background (numerator of contrast equation), and the noise is determined as the uncertainty with which that object is recorded (the standard deviation). Conceptually, if one were imaging a tumor that was found in the tissue, the signal would be the difference between the tumor and the surrounding material while the noise would be the standard deviation of the signal level within the tumor. The ratio of these two numbers would be the signal-to-noise ratio. In other words, for the reconstructed phantom images, the signal-to-noise (SNRs) were computed using the expression SNR = (T—B)/g(B), where T was the mean activity in a spherical tumor model region of interest (ROI), B was the mean activity in a background region and ct(B) was the standard deviation of voxel values in the background region [22-25].
3. MATERIAL AND METHODS
The scanner is made of four detector head, each one composed of 2 x 2 cm2 of pixilated LYSO matrix of 10 x 10 crystals, 2 x 2 mm wide and 10 mm deep. Each opposite block LYSO pixilated detector optically coupled to PS-PMT (Hamamatsu R8900U-00-C12). The cross plate PS-PMT (R8900U-00-C12) contain 6 X anode plates plus 6 Yanode plates that collect the amplified charges generated by scintillation events. Angertype logic discredited positioning circuit (DPC) multiplexed readout connected to PMT of each head. The fast-slow preamplifier is used in the fabricated animal PET (Fig. 1).
1
nPHEOPBI H TEXHHKA ЭКСПЕРHМЕНТА № 2 2014
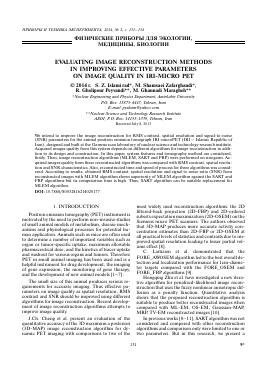
Fig. 2. Reconstructed images by Filtered back projection FBP (a), MLEM (b) and SART algorithm (c).
The four block detectors are located on a rotating gantry. In each angle, The LOR's (Line of Response) from two opposite columns and opposite-but-one columns are making each sinogram. In the configuration which we adopted, the acquisition is made with the detectors 50 mm apart: with d = 50 mm and b = 2 mm as crystal size, smallest detectable angle is A9 = tan-1(b/d), which generates n/A = 78 angular bins. Then we have 19 radial bins and their angular bins are depends on the angels of rotation. The radial bins are then filled as a distance of each LOR to the center o
Для дальнейшего прочтения статьи необходимо приобрести полный текст. Статьи высылаются в формате PDF на указанную при оплате почту. Время доставки составляет менее 10 минут. Стоимость одной статьи — 150 рублей.