FULL SKY HARMONIC ANALYSIS HINTS AT LARGE ULTRA-HIGH ENERGY COSMIC RAY DEFLECTIONS
P. G. Tinyakov* F. R. Urban**
Université Libre de Bruxelles. Service de Physique Théorique. CP225 1050, Brussels, Belgium
Received October 24, 2014
The full-sky multipole coefficients of the ultra-high energy cosmic ray (UHECR) flux have been measured for the first time by the Pierre Auger and Telescope Array collaborations using a joint data set with E > 10 EeV. We calculate these harmonic coefficients in the model where UHECR are protons and sources trace the local matter distribution, and compare our results with observations. We find that the expected power for low multipoles (dipole and quadrupole, in particular) is sytematically higher than in the data: the observed flux is too isotropic. We then investigate to which degree our predictions are influenced by UHECR deflections in the regular Galactic magnetic field. It turns out that the UHECR power spectrum coefficients Ct are quite insensitive to the effects of the Galactic magnetic field, so it is unlikely that the discordance can be reconciled by tuning the Galactic magnetic field model. On the contrary, a sizeable fraction of uniformly distributed flux (representing for instance an admixture of heavy nuclei with considerably larger deflections) can bring simulations and observations to an accord.
Contribution for the JETP spécial issue in honor of V. A. Rubakov's 60th birthday
DOI: 10.7868/S0044451015030210
1. INTRODUCTION
Despite the fact that the actual sources of ultra-high energy cosmic rays (UHECRs) have still not been identified, it is rather natural to expect them to follow, to some extent, the large scale structure (LSS) observed in the sky. Indeed, the propagation distance of UHECRs of above 101B eV is limited to several hundred mega-parsecs due to their interaction with the intergalactic medium fl, 2]. The matter distribution is not homogeneous over such distances, hence if UHECRs are ex-tragalactic, one expects an anisotropy in their arrival direction distribution, reflecting the inhomogeneity of the source distribution. Such anisotropics, on a sphere, can be revealed via a harmonic analysis, where the coefficients of the complete set of spherical harmonics carry the information, multipole by multipole, about the possibly nonuniform UHECR flux. The harmonic analysis is thus a way to compress the data in a form most suitable for statistical tests.
* E-mail: petr.tiniakov'fflulb.ac.be
**E-mail: furban'fflulb.ac.be
Recently the Telescope Array (TA) and Pierre Auger Observatory (PAO) collaborations have joined forces to provide the first full-sky UHECR map [3]. With single earth-based experiments being forcedly blind to a big chunk of the sky, only the combined data sets from two or more machines can provide the complete picture. This is particularly important for the harmonic analysis which, as detailed in the joint TA/'PAO paper, strongly benefits from a whole sky coverage, both theoretically/'qualitatively (no need to assume anything about the flux) and practically/quantitatively (some errors arc significantly suppressed) [4]. Joining the data of the two experiments thus made possible, for the first time, to measure the harmonic multipoles of the UHECR flux distribution in an assumption-free way.
One natural question is then: is the harmonic power spectrum expected from the LSS the same as that actually observed? The caveat here is that UHECRs do not travel on a straight line from source to the Earth, because of the magnetic fields they encounter on their way; these deflect their trajectories and mask the original arrival directions, and with that the sources or UHECRs. The most relevant magnetic field in this rc-
spoct is housed by our own Galaxy (Galactic magnetic field, GMF), with strength in the microgauss range, see for instance [5] and references therein. The GMF is separated into large- (regular or coherent) and small-turbulent or random) scale components, the regular part dominating the cosmic ray deflections. When combined, these fields are expected to steer 10 EeV protons by a few degrees, far away from the galactic plane, up to several tens of degrees at very low galactic latitudes. Now, what does this mean for the harmonic analysis? Are the anisotropics erased, or is the power spectrum distorted?
What we find in this analysis is that there is a striking mismatch between the power spectrum we simulate from the LSS, assuming a purely protonic primary composition, and the one reconstructed from the data: the amplitudes of low multipoles (particularly, the quadrupole C-2, the second momentum in the harmonic decomposition) in the data are significantly lower than the calculated LSS ones. The scope of this work is to delve deeper into this issue; in particular, we want to understand the role of the GMF in this result.
Before embarking on the analysis, we briefly summarise our findings.
• There is a lack of power in the low multipoles (notably, dipole and quadrupole) as observed by TA/'PAO compared to the expectations from protons tracing LSS.
• The regular GMF shuffles direction-dependent single harmonic coefficients, demonstrating how these are not fully reliable indicators of source anisotropy.
• However, the power spectrum is barely affected by the regular GMF, which means that the latter can not bring observations and simulations to an accord.
• The random GMF has also very little effect on the low multipoles.
• A moderate fraction of uniformly-distributed events (which could, for instance, represent an admixture of heavy nuclei) instead does temper the tension between data and expectations, for it contributes to the isotropisation of the signal even on largest angular scales.
For the rest of the paper, we will begin summarising the results of the joint TA/'PAO analysis in Sec. 2; then we will introduce the simulated power spectra from the LSS, and discuss the missing quadrupole problem in Sec. 3. The impact of the GMF on this result is detailed in Sec. 4, whereas the turbulent GMF is discussed in Sec. 5, alongside the effect on the power spectrum of a different composition of cosmic ray primaries. We will conclude in Sec. 6.
2. THE JOINT TA/PAO ANALYSIS
As any angular distribution on the unit sphere, the flux $(n) of cosmic rays in a given direction n can be decomposed in terms of a multipolar expansion onto the spherical harmonics )),„ (n):
i
$(ll) = ^ "tm>£m(n). (1)
£>0 m=-£
Anisotropy fingerprints are encoded in the u£m multi-poles. Nonzero amplitudes in the (' modes contribute in variations of the flux 011 an angular scales of about 7T/1 radians.
Cosmic ray events, in this language, are then simply sample points for the underlying sources distribution 011 the sphere. However, because the sky coverage is nonuniform, what these events are sampling is the flux times exposure distribution. Now, with full-sky but nonuniform coverage, the customary recipe [3] for decoupling directional exposure effects from anisotropy ones consists in weighting the observed angular distribution by the inverse of the relative directional exposure function uJ,.(n), so that, inverting Eq. (1), the actual data points are unbiassed estimators of the underlying flux:
N 1 \ \ - 1 1 in (.H()
(n,
where one can prove [3] that upon averaging over a large number of realisations one has (u£m) = alm. Here N is the number of events, which are described as Dirac delta functions centred at the actual arrival directions iij.
While the individual u£m coefficients are direction-dependent, the angular power spectrum coefficients C£, defined as averages of |u£m|2 over m,
1 £
Cl = 21+1 ^ lU£m|2' ^ m=—£
are rotation-independent quantities. Given that the regular GMF results in a (direction-dependent) rotation of the events, one might expect that the power spectrum coefficients C£ are much less sensitive to the presence of GMF than individual amplitudes u£m.
Now, in order to achieve full-sky coverage, the data of two different experiments must be combined; hence, the total exposure has to be cross-calibrated in order to not introduce spurious effects in Eq. (2). The details of the cross-calibration procedure, and its performances, do not matter for us here, but can be found
in Ref. [3] (see also [6, §2]). Note, however, that in the cross-calibration procedure only a small subset of all events — those in the region of overlapping exposures — are used, and that the cross-calibration errors propagate mainly into the m — 0 components of the coefficients (in equatorial coordinates).
The data sets used in the analysis consist of UHECRs with energies above 10 EeV, which amounts to 8259 for PAO, and 2130 for TA. The Table reports the results for the aim coefficients as presented in the TA/PAO joint paper.
As one may see, there are no statistically significant deviations from isotropic expectation in any of the harmonic coefficients, the largest discrepancy being in the value of ai-i. One also observes that the errors are systematically larger for m = 0, particularly for the dipole i = 1: a consequence of the cross-calibration procedure.
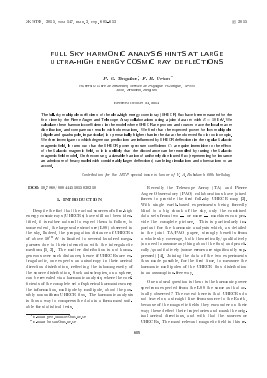
Fig. 1. The UHECRs angular power spectrum from the data and from simulated flux maps at different smearing angles, see the main text for details (color online see arXiv:1411.2486)
3. LARGE SCALE STRUCTURES AND ANISOTROPIES
In order to compare the power spectrum reconstructed from the data with the expectations from the LSS model, we need to build the flux map which we are going to sample with random Monte-Carlo events and derive expectations for the multipole coefficients. The procedure we used to build the expected flux is described in detail in [7, 8]. We first choose a galaxy catalogue, in this case the 2MASS Galaxy Redshift Catalog (XSCz) that is derived from the 2MASS Extended Source Catalog (XSC). The flux is calculated from the flux-limited subsample of galaxies with the apparent magnitude m < 12.5 at distances D < 25
Для дальнейшего прочтения статьи необходимо приобрести полный текст. Статьи высылаются в формате PDF на указанную при оплате почту. Время доставки составляет менее 10 минут. Стоимость одной статьи — 150 рублей.