ГЕНЕТИКА, 2014, том 50, № 12, с. 1440-1447
ГЕНЕТИКА ЖИВОТНЫХ
УДК 575.2:636.39
GENETIC DIVERSITY ANALYSIS OF EIGHT INDIGENOUS GOAT BREEDS (GROUPS) IN CHINA USING AFLP MARKERS
© 2014 Y. L. Liu1, 2, 3, M. Cheng2, 4, M. F. Jiang2, 4, Yo. Wang1, 4, Jie Wang1, 4, and X. H. Fu5
1Sichuan Key Laboratory of Conservation and Utilization of Animal Genetic Resources in Tibetan Plateau, Southwest University for Nationalities, Chengdu, Sichuan 610041, China
e-mail: wangyong010101@swun.com 2Key Laboratory of Animal Genetics & Breeding (Southwest University for Nationalities), State Ethnic Affairs Commission
and Ministry of Education, Chengdu, Sichuan 610041, China e-mail: mingfengjiang@vip.sina.com 3Tibetan Plateau Institute, Southwest University for Nationalities, Chengdu, Sichuan 610041, China 4College of Life Science and Technology, Southwest University for Nationalities, Chengdu, Sichuan 610041, China
5HYXBiotech LLC Received December 18, 2013
Eight goat breeds from Chengdu, Lezhi, Jintang, Baiyu, Yingshan, Hejiang, Jiangan, and Jialing in Sichuan, China were analyzed for genetic diversity using AFLP markers. A total of 261 individuals were analyzed using eight selective AFLP primer combinations which generated 174 discernible fragments, of which 80 were polymorphic with an average of 27.15 bands per primer pair. Shannon's gene diversity index among breeds ranged from 0.0888 to 0.2289, and the highest and the lowest gene diversity index among breeds were the Yingshan Black goat (0.2289) and the Baiyu Black goat (0.0888) respectively. The genetic distance (DR) among eight goat breeds were calculated by Rogers'genetic distance. Based on the analytical results, systematic trees were constructed by using the unweighted pair-group method with arithmetic average (UPGMA) and the neighbor joining (NJ) methods. Eight breeds were divided into two main clusters by using cluster analysis, one of which including two subclusters. The clustering results agreed well with the origin of the goats and geographic distribution. The results implied that AFLP markers were informative and could provide significant insights for genetic diversity research and genetic resource conservation of indigenous goats.
DOI: 10.7868/S0016675814120066
Indigenous goat breeds from Sichuan, China have been formed by centuries of natural selection and artificial selection. The domestic goats often possess special adaptations and geographically widespread. There are up to 1.4 million goats throughout the Sichuan Province and the local goat breeds are valuable resources for goat production. These native goats provide desired products with specific meat qualities which are of interest in local markets. The demand for meat products from these local goats has been growing consistently due to their perceived image as natural, nutritious, organic, and healthy, having been produced in the natural environments with less industrial residues. In the long history of raising goats in China, the origin and breeding history of the domestic goats remain uncertain and controversial. Since these breeds were scattered across Sichuan Province, local breeds may have been largely isolated, and thus, may be genetically differentiated. Therefore, it is of great significance to assess the molecular genetic diversity of the domestic goats in Sichuan and thus understand the origin, differentiation, genetic relationship and conservation of the breed resources and develop new char-
acteristics in response to changes in the environment or market conditions in China.
Some studies have been undertaken concerning genetic diversity of goat breeds including indigenous goat breeds using microsatellite markers [1—4]. Research on livestock using AFLP fingerprinting has concentrated on cattle [5—7], pigs [8—10], sheep [11— 13], and Bos grunniens [14], and AFLP is often used for DNA fingerprint identification in wild plants species [15—19] while no further information is available on elucidating gene differentiation among different native goat breeds in China. Awareness of the value of genetic resources has stimulated the study of genetic diversity information among local breeds which is very important for understanding and developing endogenous economic genetic characterstics of breeds.
Amplified fragment length polymorphism (AFLP), a DNA fingerprinting technique based on PCR technology, is a highly reproducible, powerful and efficient multi-locus marker system. AFLP is a dominant marker system whose major advantages are that a smaller number of primer pairs can generate multiple polymorphic markers than that required when using microsatellites [20] et al., especially when performed
Table 1. The goat — raising areas, sample sizes and sampling sites
Breeds (groups) Altitude (m) Average temperature per year (°C) Relative humidity (%) Rainfall amount (mm) Code Sample sizes Sampling sites
Chengdu Ma-goat 500 16.2 80 921 CM 31 Shuangliu County
Jintang Black goat 385-1046 16.7 80 920.5 JT 29 Jintang County
Lezhi Black goat 306-585 16.6 80 890.2 LZ 34 Lezhi County
Hejiang Black goat 200-800 18.2 70-80 1184.2 HJ 30 Hejiang County
Jiangan Black goat 235-1000 18.1 78-83 1127.8 JA 28 Jiangan County
Yingshan Black goat 257-889.6 17.5 82 1054 YS 39 Yingshan County
Jialing Black goat 350-500 17.5 80 1010 JL 34 Jialing County
Baiyu Black goat 2640-5812 3.7-8.2 52 600.6 BY 36 Baiyu County
Table 2. Details about adapters and primers used for AFLP analysis
EcoRI/Msel Primers Sequences (5'-3')
Ml (pre-amplification) GATGAGTCCTGAGTAA
El (pre-amplification) GACTGCGTACCAATTC
M21 (selective amplification) GATGAGTCCTGAGTAAACC
M22 (selective amplification) GATGAGTCCTGAGTAAAGC
M23 (selective amplification) GATGAGTCCTGAGTAACAT
M24 (selective amplification) GATGAGTCCTGAGTAACGA
M25 (selective amplification) GATGAGTCCTGAGTAAGCG
E21 (selective amplification) GACTGCGTACCAATTCAAC
E22 (selective amplification) GACTGCGTACCAATTCAC
E23 (selective amplification) GACTGCGTACCAATTCTG
in a species for which only a few microsatellite markers are available. Polymorphisms which are indicated by the presence or absence of bands, correspond to single — nucleotide polymorphisms, insertions or deletions. AFLP has been used successfully to evaluate the genetic diversity and the simple identification of species. In this study, using the AFLP markers with eight primer combinations, our objectives were to assess the geographic distribution of genetic diversity within and among eight indigenous goat breeds from Sichuan and to show the genetic distances and the genetic relationships by constructing phylogenetic trees.
MATERIALS AND METHODS
Animal materials. A total of 261 randomly sampled goats from eight distinct geographical areas representing eight indigenous goat breeds in Sichuan, China were analyzed for genetic diversity. Geographical distributions, living environments, sample sizes and sampling sites of these breeds are listed in Table 1.
Sample collection and DNA extraction. Fresh blood samples were collected from a total of 261 healthy adult ewes belonging to eight local goat breeds, namely
Chengdu Ma-goat (CM, n = 31), Jintang Black goat (JT, n = 29), Lezhi Black goat (LZ, n = 34), Hejiang Black goat (HJ, n = 30), Jiangan Black goat (JA, n = 28), Yingshan Black goat (YS, n = 39), Jialing Black goat (JL, n = 34), and Baiyu Black goat (BY, n = 36). Genomic DNA extraction was conducted in accordance with Sambrook and Russell [21]. The concentration of DNA was measured using a UV-spectrophotometer (260 nm) and the quality was checked by 0.7% agarose gel electrophoresis. Then the concentrations of DNA samples were adjusted to 25 ng/^L for AFLP analysis and stored at -20°C.
AFLP analysis. AFLP adapters and primers were designed, respectively, according to Van der Lee et al. [22] and Schnell et al. [23]. The primers were synthesized in Dalian Takara Bio. Details about the adapters and primers used for AFLP analysis are shown in Table 2. Two different restriction enzymes (Msel & EcoRI) were used simultaneously for the digestion of genomic DNA samples, then these samples were placed in a 37°C PCR instrument for 4 h and incubated at 70°C to deactivate the restriction enzymes. Subsequently, adaptor ligation was performed by adding Msel-adapt-er, Eco Rl-adapter and T4 DNA ligase at 37°C for 2 h
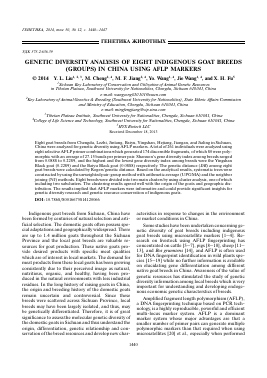
bp M2 1 2 3 4 5 6 7 8 9 10 11 12 13 14
Fig. 1. Electrophoresis pattern obtained with the primer combination E23/M24. See text.
with a last step at 65°C for 10 min. The pre-amplification reaction was conducted in a thermocycler (Mas-tercycler gradient Eppendorf), this consisted of a pre-denaturing step for 3 min at 94°C, 30 cycles of 45 s denaturing at 94°C, 1 min annealing at 56°C, an 80 s extension at 72°C and a final extension for 10 min at 72°C. After checking for the presence of fragments (200—600 bp in length) by 1% agarose electrophoresis, the amplification products were diluted 10 times. A second PCR reaction of the diluted pre-amplification products was carried out using eight primer combinations. The amplification was programmed in reference to Kladmook et al. [24]. The selected amplification products were loaded onto 6% denaturing polyacrylamide gels, and argentation was used to visualize DNA fragments [25].
Data analysis. For the diversity analysis, each PCR product was assumed to represent a unique locus and polymorphic amplified fragments were identified and scored as present (1) or absent (0). Only unambiguously scored bands were used for data analysis. Genetic distances among eight breeds were measured according to Rogers [26]. Genetic diversity was estimated by the Shannon information measure [27, 28] which involved a hierarchical partitioning of the observed genetic variation, specifically the genetic diversity within breed (Ho), the genetic diversity index of the total groups (Hsp), and the average diversity within groups (Hpop). Two dendrograms were constructed using UPGMA and NJ of the Mega 5.0 softw
Для дальнейшего прочтения статьи необходимо приобрести полный текст. Статьи высылаются в формате PDF на указанную при оплате почту. Время доставки составляет менее 10 минут. Стоимость одной статьи — 150 рублей.