ГЕНЕТИКА, 2009, том 45, № 7, с. 941-948
ГЕНЕТИКА ЖИВОТНЫХ
УДК 575.17
GENETIC DIVERSITY AND BOTTLENECK ANALYSIS OF NAGPURI BUFFALO BREED OF INDIA BASED ON MICROSATELLITE DATA
© 2009 R. S. Kataria, S. Sunder, G. Malik, M. Mukesh, P. Kathiravan, and B. P. Mishra
DNA Fingerprinting Unit, National Bureau of Animal Genetic Resources, P.B. 129, GT Road By-Pass, Karnal-132 001 (Haryana), India
e-mail: katariaranji@yahoo.co.in Received November 08, 2007; in final form, March 12, 2008
In this study, 25 heterologous bovine microsatellite markers have been used for the assessment of genetic diversity in Nagpuri buffalo, an important breed of Central India. For this, 48 DNA samples of unrelated individuals of Nagpuri buffalo were PCR amplified and microsatellite alleles were resolved in 6% denaturing, silver stained Urea-PAGE gel. Genotypic status of individuals at each locus was identified manually and data analysis carried out using POPGENE software. Observed number of alleles varied from 2 (ILSTS073 locus) to 8 (HEL13 & ILSTS058 loci) with a mean of 5.24 alleles per locus. Moderate level of heterozygosity (0.45) indicated sufficient genetic diversity existing in this buffalo population. PIC values for the microsatellite loci analysed, ranged from 0.10 (ILSTS019 locus) to 0.81 (ILSTS058 locus) with a mean of 0.53. No shift in the frequency distribution of alleles and a normal L-shaped curve indicated non-existence of any bottleneck in Nagpuri. The study thus highlights the usefulness of heterologous bovine microsatellite markers to assess the genetic variability in buffalo breeds as well. Also various diversity indices suggest sufficient genetic variability within Nagpuri buffalo that can be utilized as initial guidelines for future breeding strategies and conservation.
India is well known for possessing diverse buffalo germplasm comprising over 97 million buffaloes, accounting for more than 60% of world's buffalo population. There are ten well-characterized breeds distributed mostly in North and Central-West parts of India along with more than 70% non-descript buffalo population in different agro-climatic zones. These breeds/populations are well adapted to agro-climatic conditions of respective breeding tract, contributing not only in terms of milk but also meat and other by-products. Most of these animals are reared in unorganized dairy sector and are facing dilution due to introduction of superior germplasm like Murrah breed in order to augment the milk production for economic benefits.
Genetic diversity analysis tools like microsatellite markers can help in characterization of the descript breeds and populations for their breeding, conservation programme. These markers being highly polymorphic, locus specific and easy to use by PCR amplification, have been used extensively for genome characterization and diversity analysis in many species [1, 2]. Due to lack of information on buffalo microsatellite markers, heterologous bovine markers have been tried for genetic characterization of buffalo [3-5].
Nagpuri is a unique breed of buffalo spread out in Vidarbha region comprising five districts viz. Nagpur, Wardha, Yavatmal, Akola and Amravati of Maharashtra state of India. Farmers prefer to rear this breed mainly due to its low maintenance cost, efficiency of feed conversion, moderate production and better adaptation to local climatic conditions. The breed has shown mar-
ginal decline in population due to use of Surtí and Murrah semen in its breeding tract [6]. Though detailed information on its geographical distribution, management practices, breed characteristics, performance etc., has been collected, by carrying out surveys in native tract, information regarding genetic characterization needs to be established using molecular genetic approach. The present work was envisaged to assess genetic bottleneck based on mutation drift equilibrium in Nagpuri buffalo breed using data generated for 25 het-erologous bovine microsatellite markers.
MATERIALS AND METHODS
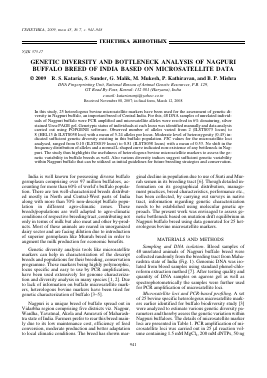
Sampling and DNA isolation. Blood samples of 48 unrelated animals of Nagpuri buffalo breed were collected randomly from the breeding tract from Maharashtra state of India (Fig. 1). Genomic DNA was isolated from blood samples using standard phenol-chloroform extraction method [7]. After testing quality and quantity of DNA samples on agarose gel as well as spectrophotometrically the samples were further used for PCR amplification of microsatellite loci.
Microsatellite loci and PCR-based profiling. A set of 25 bovine specific heterologous microsatellite markers earlier identified for buffalo biodiversity study [3] were analyzed to estimate various genetic diversity parameters and thereby assess the genetic variation within Nagpuri buffaloes. The details of microsatellite marker loci are presented in Table 1. PCR amplification of microsatellite loci was carried out in 25 ^l reaction volume containing 1.5 mM MgCl2, 200 mM dNTPs, 50 ng
Fig. 1. Breeding tract of Nagpuri buffalo.
of forward/reverse primer, ~100 ng of genomic DNA and 0.5 U of Taq DNA polymerase (Bangalore Genei, India). PCR was carried out in PTC-200 thermal cycler (MJ Research Inc., MA, USA) using cycling conditions: 2 min at 94°C, followed by 30 cycles of 1 min at 94°C, 1 min at 55°C, 1 min at 72°C and final extension at 72°C for 10 min. The PCR amplified products were resolved on 6% denaturing urea-PAGE gel (Sequi GT system, Bio-Rad, USA). The alleles were visualized by silver staining procedure and microsatellite allele sizes were estimated using 10-bp molecular size ladder (In-vitrogen, Life Technologies, CA, USA). Individual animal genotypes at 25 microsatellite loci were recorded by direct scoring of alleles manually from the silver stained gels.
Microsatellite data analysis. Microsatellite data was analysed for calculating observed number of alle-les, effective number of alleles and observed and expected heterozygosity using POPGENE v1.31 diversity analysis software [8]. Polymorphic information content (PIC) value of each marker was determined as described by previous workers [9]. The test for departure from Hardy Weinberg proportions was performed using exact probability tests provided in GENEPOP version 3.1 a [10]. Monte Carlo method [11] was applied to compute unbiased estimates of the exact probabilities (P- values). Length of chain was set to be 50.000 iterations with critical P value adjusted to 0.05 at population level. Within-population-inbreeding estimates (FIS) at each microsatellite loci were estimated using
FSTAT version 2.9.3.2 computer programme [12]. The level of significance (P < 0.05) was determined from permutation test with the sequential Bonferroni procedure applied over all loci.
To evaluate whether the Nagpuri buffalo has experienced a recent reduction in the effective population size or genetic bottleneck, different approaches were followed [13]. In the first approach three different tests, namely a "sign test", a "standardized differences test" and a "Wilcoxon sign-rank test" were employed under different models of microsatellite evolution like the Infinite Allele model (IAM) [14], Stepwise Mutation model (SMM) [15] and Two-phased models (TPM) [16]. These methods test for the departure from mutation drift equilibrium based on heterozygosity excess or deficiency. The probability distribution was established using 1000 simulations under three models. The test was conducted using BOTTLENECK v1.2.02 software (http://www.ensam.inra.fr/URLB).
The second approach that was a qualitative graphical method was used to visualize the allele frequency spectra [17]. The microsatellite alleles were classified in 10 frequency classes, which allow checking whether the distribution followed the normal L-shaped form, where alleles with low frequencies (0.01-0.1) are the most abundant. This test was also performed using bottleneck v1.2.02 software.
Table 1. Details of heterologous bovine microsatellite markers used to study genetic diversity in Nagpuri buffalo
Microsatellite locus Sequence Allele size range in Buffalo* Chromosome location in cattle
CSRM60 For-5' Rev-5 AAGATGTGATCCAAGAGAGAGGCA-3' -AGGACCAGATCGTGAAAGGCATAG-3' 160- 188 10
ILSTS026 For-5' Rev-5 CTGAATTGGCTCCAAAGGCC-3' -AAACAGAAGTCCAGGGCTGC-3' 140- 158 2
HEL13 For-5' Rev-5 -TAAGGACTTGAGATAAGGAG-3' -CCATCTACCTCCATCTTAAC-3' 165- 191 11
ILSTS030 For-5' Rev-5' CTGCAGTTCTGCATATGTGG-3' -CTTAGACAACAGGGGTTTGG-3' 146- 158 2
ILSTS033 For-5' Rev-5' TATTAGAGTGGCTCAGTGCC-3' -ATGCAGACAGTTTTAGAGGG-3' 126- 138 12
ILSTS017 For-5' Rev-5' GTCCCTAAAATCGAAATGCC-3' -GCATCTCTATAACCTGTTCC-3' 104- 124 X
ILSTS019 For-5' Rev-5' AAGGGACCTCATGTAGAAGC-3' -ACTTTTGGACCCTGTAGTGC-3' 160- 180 29
ILSTS045 For-5' Rev-5' -TTCTGGCAAACTATTCCACC-3' -CATGAAAGACACAGATGACC-3' 169- 177 11
ILSTS034 For-5' Rev-5' AAGGGTCTAAGTCCACTGGC-3' -GACCTGGTTTAGCAGAGAGC-3' 130- 144 5
ILSTS058 For-5' Rev-5' GCCTTACTACCATTTCCAGC-3' -CATCCTGACTTTGGCTGTGG-3' 118- 170 17
ILSTS056 For-5' Rev-5' GCTACTGAGTGATGGTAGGG-3' -AATATAGCCCTGGAGGATGG-3' 140- 172 12
ILSTS089 For-5' Rev-5' AATTCCGTGGACTGAGGAGC-3' -AAGGAACTTTCAACCTGAGG -3' 118- 126 29
CSSM66 For-5' Rev-5' ACACAAATCCTTTCTGCCAGCTGA-3' -AATTTAATGCACTGAGGAGCTTGG-3' 168- 202 14
ILSTS036 For-5' Rev-5' GAGTATTATGCTTGGGAGGC-3' -AGACAGGATGGGAAGTCACC-3' 143- 157 11
ILSTS095 For-5' Rev-5' GAAAGATGTTGCTAGTGGGG-3' -ATTCTCCTGTGAACCTCTCC-3' 197- 205 21
ILSTS029 For-5' Rev-5' TGTTTTGATGGAACACAGCC-3' -TGGATTTAGACCAGGGTTGG-3' 160- 168 3
ILSTS028 For-5' Rev-5' TCCAGATTTTGTACCAGACC-3' -GTCATGTCATACCTTTGAGC-3' 140- 168 11
ILSTS025 For-5' Rev-5' GTTACCTTTATATAAGACTCCC-3' -AATTTCTGGCTGACTTGGACC-3' 115- 135 2
ILSTS052 For-5' Rev-5' CTGTCCTTTAAGAACAAACC-3' -TGCAACTTAGGCTATTGACG-3' 147- 179 21
ILSTS031 For-5' Rev-5' AATTCTAGGTGAACAGCAGC-3' -AAGACATACTCTCAGACTCC-3' 250- 260 24
ILSTS073 For-5' Rev-5' AGGGCAGGAGTAATCTTTGG-3' -AACAGAGAGTATGGTGGTGG-3' 156- 176 19
ILSTS060 For-5' Rev-5' TAGGCAAAAGTCGGCAGC-3' -TTAAGGGGACACCAGCCC-3' 16
Для дальнейшего прочтения статьи необходимо приобрести полный текст. Статьи высылаются в формате PDF на указанную при оплате почту. Время доставки составляет менее 10 минут. Стоимость одной статьи — 150 рублей.