ГЕНЕТИКА РАСТЕНИЙ
УДК 575.17:582.951.6
GENETIC DIVERSITY IN WILD POPULATIONS OF Paulownia fortunei
© 2014 H. Y. Li1,2, G. X. Ru1, J. Zhang3, and Y. Y. Lu1
1Henan Agricultural University, Zhengzhou, 450002 P.R. China e-mail: lhy5100730@126.com 2North China University of Water Resources and Electric Power, Zhengzhou, 450011 P.R. China 3Henan Institute of Engineering, Zhengzhou, 451191 P.R. China Received April 1, 2014
The genetic diversities of 16 Paulownia fortunei populations involving 143 individuals collected from 6 provinces in China were analyzed using amplified fragment length polymorphism(AFLP). A total of 9 primer pairs with 1169 polymorphic loci were screened out, and each pair possessed 132 bands on average. The percentage of polymorphic bands (98.57%), the effective number of alleles (1.2138—1.2726), Nei's genetic diversity (0.1566—0.1887), and Shannon's information index (0.2692—0.3117) indicated a plentiful genetic diversity and different among Paulownia fortunei populations. The genetic differentiation coefficient between populations was 0.2386, while the gene flow was 1.0954, and the low gene exchange promoted genetic differentiation. Analysis of variance indicated that genetic variation mainly occurred within populations (81.62% of total variation) rather than among populations (18.38%). The 16 populations were divided by unweighted pair-group method with arithmetic means (UPGMA) into 4 groups with obvious regionalism, in which the populations with close geographical locations (latitude) were clustered together.
DOI: 10.7868/S0016675814100075
Paulownia fortunei belonging to Paulownia (Scro-phulariaceae)is native to China and this excellent fast-growing tree species is featured by fast growth, good form, tall tree, and strong disease resistance [1]. P. for-tunei is widely distributed to the south of the Changjiang River in nature (N 20°-30°, E 100°-122°), with long cultivation history, high adaptability to changeable ecological conditions, and rich in-traspecific variation. To fully use the intraspecific variation and understand the rules of multi-level variation, H. Ma conducted multi-level experiments (populations, families, and individuals) for selection of good families. The leaf anatomy of P. fortunei was studied to reveal the anatomic differences among populations and the relationship with ecological environment [2, 3]. Molecular markers including random amplified polymorphic DNA (RAPD), restriction fragment length polymorphism (RFLP), and inter-simple sequence repeat (ISSR) have been introduced to study the genetic diversity of Paulownia plants [4-6]. However, there is little research on the genetic diversity and genetic differentiation of P. fortunei populations at the molecular level. Research outside of China also focuses primarily on the growth characteristics and physio-chemical properties [7, 8].
The deterioration of the ecological environment and long term man-made deforestation have led to severe habitat loss of this fast growing species, shrinking distribution, and a dramatic decline in populations quantity, which seriously threaten the survival and development of P. fortunei resources in China. Therefore, it is urgent to investigate and collect P. fortunei
materials from different localities and systematically study its genetic diversity.
Amplified fragment length polymorphism (AFLP) with high polymorphism and high repeatability provides abundant information on genetic variation and thus is a powerful tool to study the genetic diversity of populations [9, 10]. In this study, 16 representative populations from major distribution regions were used as test materials for analysis of genetic diversity and genetic differentiation using AFLP. The objectives are to reveal the rules of genetic variation and to provide a theoretical basis for protection and reasonable utilization of P. fortunei populations.
MATERIALS AND METHODS
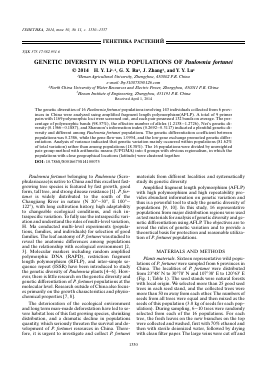
Plants materials. Sixteen representative wild populations of P. fortunei were sampled from 6 provinces in China. The localities of P. fortunei were distributed from 23°48' N to 30°70' N and 107°38' E to 120°63' E (Fig. 1; Table 1). The seed stands were natural forests with local origin. We selected more than 25 good seed trees in each seed stand, and the collected trees were more than 50 m away from each other. The numbers of seeds from all trees were equal and then mixed as the seeds of this population (3.0 kg of seeds for each population). During sampling, 6-10 trees were randomly selected from each of the 16 populations. For each tree, the fresh leaves on the new branches on the top were collected and washed, first with 70% ethanol and then with sterile deionized water, followed by drying with clean filter paper. The large veins were cut off and
Fig. 1. Geographical distribution of the sampled populations of P. fortunei in China.
the materials were stored in a cryogenic refrigerator at —70°C until used.
DNA extraction. Total DNA was extracted and purified from the new leaves using the cetyltrimethyl ammonium bromide (CTAB) method [11]. The extracted DNA was tested with 0.8% agarose gel electrophoresis and a nucleic acid detector for measurement of content and purity, and then stored at —20°C until used.
PCR amplification. Nine primer pairs were screened out (Table 2) and selectively amplified after fluorescence labeling (labeled at the 5' end of MseI). The amplified system (25 |L) contained the diluted sample after pre-expansion (2 |L), 10x polymerase chain reaction (PCR) buffer (2.5 |L), dNTPs (0.5 |L), PstI and MseI (each 1 |L), and Taq enzyme (0.5 |L), complemented with ddH2O. The above system was mixed evenly and after several seconds of cen-trifugation, was selectively amplified in the following procedure: first cycle: amplification at 94°C for 30 s, predenaturation at 65°C (the temperature was reduced by 0.7°C for each cycle subsequently) for 30 s, extension at 72°C for 80 s, 12 cycles; denaturation at 94°C
for 30 s, annealing at 55°C for 30 s, extension at 72°C for 80 s, 23 cycles; finally extension at 72°C for 5 min, and storage at 4°C.
Electrophoresis and data analysis. The amplified samples underwent electrophoretic separation on an ABI377 automatic sequencer, and the obtained AFLP fingerprints were analyzed on GeneScan 3.1 to generate an original matrix composed of "l" and "0". Indices including percentage of polymorphic loci (P), number of observed alleles (Na), effective number of alleles (Ne), Nei gene diversity index (H), Shannon's information index (I), Nei's genetic distance at population level (D), total gene diversity of populations (Ht), gene diversity within population (Hs), genetic differentiation coefficient among populations (G^), and gene flow (Nm) were computed for each population with POPGENE 1.32 [12]. Clustering analysis was conducted on the basis of Nei's genetic distance [13] using unweighted pair-group method with arithmetic means (UPGMA). Analysis ofvariance (AMOVA) was performed on AMOVA 1.55 [14].
Table 1. The tested P. fortunei in this study
No. Collection location Code Sample no. Latitude (N) Longitude (E)
1 Yichang, Hubei YC 6 30°70' 111°28'
2 Yueyang, Hunan YY 10 29°35' 113°13'
3 Zhangjiajie, Hunan ZJJ 8 29°12' 110°47'
4 Shaoyan, Hunan SY 10 27°23' 111°47'
5 Hengyang, Hunan HY 10 29°90' 112°57'
6 Chengzhou, Hunan CZ 6 25°77' 113°02'
7 Ganzhou, Jiangxi GZ 10 25°83' 114°93'
8 Yichun, Jiangxi YCH 8 27°80' 114° 40'
9 Quzhou, Zhengjiang QZ 10 29°03' 119°17'
10 Lishui, Zhengjiang LS 8 28°45' 119°92'
11 Wenzhou, Zhengjiang WZ 10 28°01' 120°63'
12 Fuling, Chongqing FL 10 29°70' 107°38'
13 Liuzhou, Guangxi LZ 10 24°33' 109°42'
14 Hechi, Guangxi HC 10 24°74' 108°06'
15 Hezhou, Guangxi HZ 10 24° 40' 111°57'
16 Wuzhou, Guangxi WZH 7 23°48' 111°27'
Table 2. The polymorphism of different primers combination in P. fortunei populations
Primer combination No. of total bands No. of shared bands Polymorphic rate, %
P-GAA/M-CAC 140 140 100.00
P-GAA/M-CAG 148 148 100.00
P-GAC/M-CTA 127 127 100.00
P-GAG/M-CAC 98 93 94.90
P-GAG/M-CAG 142 142 100.00
P-GAG/M-CTA 128 123 96.09
P-GAT/M-CAC 123 122 99.19
P-GAT/M-CAG 92 86 93.48
P-GTG/M-CAG 188 188 100.00
Total 1186 1169 98.57
Mean 131.8 129.9 98.57
P-GAG/M-CAG, and P-GTG/M-CAG, but was the lowest in P-GAT/M-CAG (93.48%), indicating that the 9 primer pairs showed high ability for detection of intra- and inter- population genetic variations.
Genetic diversity analysis
The most commonly used indices for measurement of population genetic diversity are percentage of polymorphic loci (P), number of observed alleles (Na), effective number of alleles (Ne), Nei's diversity index (H), and Shannon's information index (I). The statistical results (Table 3) showed that P ranged from 77.31 to 82.87% (mean 78.70%), Ne ranged from 1.2138 to 1.2726 (mean 1.2293), Hranged from 0.1566 to 0.1887
RESULTS AFLP amplification analysis
Nine of the 64 primer pairs were screened out and used in AFLP ofgenome DNA for P. fortunei materials to generate clear polymorphism fingerprints. From the 143 samples, a total of 1169 polymorphic bands of 70— 500 bp were detected, and each pair contained 132 bands on average, with the polymorphic rate of 98.57% (Table 2), indicating that there are had a high proportion of polymorphic bands. Among them, P-GTG/M-CAG possessed the most polymorphic bands (188), while P-GAT/M-CAG had the fewest polymorphic bands (86). The polymorphic rate was 100% in 5 pairs: P-GAA/M-CAC, P-GAA/M-CAG, P-GAC/M-CTA,
Table 3. Genetic diversity of P. fortunei populations
Population Percentage of polymorphism loci (P), % Na N H I
YC 81.48 1.8148 1.2726 0.1887 0.3117
YY 79.17 1.7917 1.2508 0.1771 0.2957
ZJJ 80.56 1.8056 1.2291 0.1654 0.2812
SY 79.89 1.7995 1.2443 0.1739 0.2921
HY 81.02 1.8102 1.2532 0.1781 0.2978
CZ 81.02 1.8102 1.2523 0.1795 0.3003
GZ 77.70 1.7870 1.2470 0.1756 0.2938
YCH 80.56 1.8056 1.2403 0.1717 0.2897
QZ 82.41 1.8241 1.2665 0.1868 0.
Для дальнейшего прочтения статьи необходимо приобрести полный текст. Статьи высылаются в формате PDF на указанную при оплате почту. Время доставки составляет менее 10 минут. Стоимость одной статьи — 150 рублей.