ГЕОХИМИЯ, 2014, № 1, с. 76-85
GEOCHEMICAL CHARACTERIZATION OF ADSORBED LIGHT GASEOUS ALKANES IN NEAR SURFACE SOILS OF THE EASTERN GANGA BASIN
FOR HYDROCARBON PROSPECTING
© 2014 Ch. Srinivas", T. Madhavi", M. Lakshmi", Devleena Mani", M. S. Kalpana", D. J. Patil",
A. M. Dayal" and S. V. RajuA
aNational Geophysical Research Institute (CSIR) Uppal Road, Hyderabad — 500606, India bDirectorate General of Hydrocarbons (DGH), India e-mail: ch.shrinivaas@gmail.com Поступила в редакцию 3.09.2011 г. Принята к печати 17.07.2012 г.
This study aims to assess the hydrocarbon potential of Ganga basin utilizing the near surface geochemical prospecting techniques. It is based on the concept that the light gaseous hydrocarbons from the oil and gas reservoirs reach the surface through micro seepage, gets adsorbed to soil matrix and leave their signatures in soils and sediments, which can be quantified. The study showed an increased occurrence of methane (C1), ethane (C2) and propane (C3) in the soil samples. The concentrations of light gaseous hydrocarbons determined by Gas Chromatograph ranged (in ppb) as follows, C1: 0—519, C2: 0—7 and C3: 0—2. The carbon iso-topic (VPDB) values of methane varied between —52.2%e to —27.1%e, indicating thermogenic origin of the desorbed hydrocarbons. High concentrations of hydrocarbon were found to be characteristic of the Muzaf-farpur region and the Gandak depression in the basin, signifying the migration of light hydrocarbon gases from subsurface to the surface and the area's potential for hydrocarbon resources.
Keywords: hydrocarbons, microseepage, thermogenic, isotopes, Ganga basin.
DOI: 10.7868/S0016752514010087
INTRODUCTION
The baseline distribution of hydrocarbons over a wide area is essential in the prospecting technique to locate any anomalous occurrence of hydrocarbons. Anomalous hydrocarbon compositions of surface sediments could confirm nearby seepage and thus aid in locating previously unidentified petroleum sources for future exploration [1]. The basic assumption of all near surface geochemical prospecting techniques is that the hydrocarbons migrate to the surface from the subsurface petroleum accumulations through microseepage and leave their signatures in the near surface soils [2—7]. The presence of surface seeps (macro/micro) unequivocally documents that hydrocarbons have been generated at depth and have migrated to the surface. Of all the surface exploration techniques only hydrocarbon seeps view direct evidence of the composition of generated hydrocarbons in the spatial pattern of migration before drilling [8]. Micro seeps are invisible and can be recognized by the presence of anomalous concentrations of light hydrocarbons (C1 to C4) in the near surface soils/sediments along with other sur-
face manifestations of hydrocarbon seepage which can be in the form of microbial and trace element anomalies, mineralogical changes, altered electrical, magnetic and seismic properties. These near surface anomalies provide clues on the nature and composition of sub-surface petroleum occurrences and help to demarcate the anomalous hydrocarbon zones and grade the basins frontier [9—12]. Surface geochemical study for light gaseous hydrocarbons has been carried out in eastern part of Ganga basin, which is designated as a prospective basin [13], to assess the hydrocarbon potential of the basin. There are reports of minor gas encountered during drilling of wells Tilhar-1 and Shahjahanpur-1 [14], and minor inflammable gas from Karnapur Formation (Shahjahanpur-1 well) of Ganga basin demonstrating the area's potential for hydrocarbons.
GEOLOGICAL SETTING
Ganga basin is one of the major sedimentary basins of India located in the northern margin of the Indian
Table 1. Generalised stratigraphie sequence of Ganga basin [14]
Age Group/Formation Thickness(m)
Cenozoic Quaternary Alluvium 200-426
Tertiary Neogene Upper Siwalik 200-1300
Middle Siwalik 250-1970
Lower Siwalik 130-1540
Paleogene Matera 400
Mesozoic Cretaceous
Jurassic
Triassic
Paleozoic Ordovician to Permian -
Cambrian Karnapur 50-450
Proterozoic Precambrian Tilhar 210-380
Ujhani 130-850
Madhubani 2430+
Bahraich 527+
Basement -
platform. The basin is limited by subsurface Monghyr— Saharsa ridge in the east and Delhi-Sar-godha ridge in the west. In the north it is bounded by the Siwalik foothills. The exposed Vindhyan sediments and Bundelkhand massif limit the basin in the south.
The stratigraphy of the basin constitutes the lower most formation representing the lower Vindhyan group, overlain by three units of upper Vindhyan group. The Tertiary sediments have been divided in to five formations including three divisions of Siwalik group. The generalized stratigraphic sequence is given in Table 1. The tectonic setup represents a Proterozoic to Lower Paleozoic basin, superimposed by Cenozoic sedimentation. Four tectono-sedimentation cycles are recognized. These are Mesoproterozoic, Late Neopro-terozoic-Lower Paleozoic, Paleogene and Neogene sequences. The Mesoproterozoic sequence represents epigrade metamorphic rocks characterized by phyllitic shale and orthoquartzite. Ediacaran Lower Paleozoic sequence uncoformably overlies this and represents deposition in typical platform limestone- ortho-quartzite-shale facies. End of this sequence is marked by a phase of compression. This was followed by a period of extensive erosion and deposition of Paleogene sediments in passive-margin continental setup. There-
after, thick blanket of overfilled siliciclastics sediments of Miocene and younger alluvium were deposited [15].
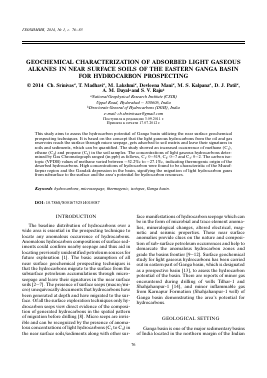
Recent gravity-magnetic data and drilled well information suggested ten major tectonic elements controlling the basin floor architecture [16]. Tectonic map of Ganga basin is given in Fig. 1 along with study area. Two long and linear horst features along Agra-Luc-know and Allahabad-Sitamarhi alignments divides the Ganga basin into a series of grabens/low and horst features arranged in a sub-parallel fashion. Singh and Rastogi (1973) [17] suggested WNW-ESE and E-W trending weak zones within alluvium which controlled the pattern of sedimentation. Besides, there are major deep-seated faults, which not only exercised control in basinal architecture but also controlled sedimentation and post depositional structure of the basin. The structural trends in the east of Aravalli-Delhi belt are sub-latitudinal up to the eastern limit of Ganga basin defined by Monghyr-Saharsa horst. Ganga basin is a poly-historic basin with multi phase evolution from a cratonic — pre-cratonic to extensional rifting to a convergent margin type [18].
The petroleum geology of the basin shows the expected reservoir rocks to be the limestones, dolomites and sandstones in Lower to Upper Vindhyans (Pre-
75°00'
77°30'
80°00'
82°30'
85°00'
87°30'
LEGEND
1. DELHI-SARGODHA RIDGE
2. SHIKOHABAD-LUCKNOW FARENDA
3. BUNDELKHAND-ALLAHABAD RIDGE
4. ZAMANIA-SITMARHI RIDGE
5. HONGHYR-SAHARSA RIDGE
6. SAHASPUR DEPRESSION
7. PURANPUR DEPRESSION
8. BAHRAICH DEPRESSION
9. GANDAK DEPRESSION
10. MADHUBANI DEPRESSION
11. PURNEA DEPRESSION
12. DELHI-HARIDWAR INVERSION
13. UJHANI-BHINGA INVERSION
14. SARDA-SEMARI-HAZARA INVERSION
75°00'
77°30'
80°00'
82°30'
85°00'
87°30'
Fig. 1. Tectonic map of Ganga Basin with study area [19].
cambrian to Cambrian) and the sandstones in Lower Siwalik (Middle Miocene) Formations [20]. The source rocks are the argillaceous sediments of Pre-cambrian to Cambrian age and of Middle Miocene age. The Intra-formational shales are believed to be the expected cap rocks.
FIELD WORK, SAMPLING AND ANALYTICAL PROCEDURE
A total of 151 soil samples of about 500 g were collected in the eastern part of Ganga basin from a depth of 1.5—5 m at an interval of 4—5 km by manual hammering using hollow metal pipe with their Global positioning System (GPS) locations (Fig. 2). The collected core soil samples were packed in aluminum foils and sealed in poly metal packs [21].
One gram of wet sieved 63^ soil sample was treated with 50% ortho-phosphoric acid under partial vacuum to desorb the hydrocarbons. CO2 gas evolved during decomposition of carbonates in soil is trapped in 20% potassium hydroxide solution provided in the degasifi-
cation apparatus and the desorbed gases were collected through water displacement in graduated tube fitted with rubber septa. The volume of desorbed gas was recorded and 500 ^L of gas sample was injected into Varian CP 3380 Gas Chromatograph (GC) fitted with Porapak Q column, equipped with flame ionization detector. GC was calibrated using external standards with known concentrations of methane, ethane, propane, /-butane and «-butane. Quantitative estimation of light gaseous hydrocarbon constituents in each sample was made using peak area measurements and correction for moisture content on wet basis was applied. The hydrocarbon concentration values of individual hydrocarbons from methane through propane were expressed in parts per billion (ppb) on dry-weight basis. The %RSD for C1-C3 is < ±20%.
Carbon isotopic composition of light hydrocarbons from soil samples were determined using GC—C— IRMS, which comprises of Agilent 6890 GC coupled to a Finnigan-Delta PlusXP IRMS via GC combustion III interface. 1 mL of desorbed gas was injected to
84°30'0'' 85°00'0'' 85°30'0'' 86°00'0" 86o30'0" E
o m
VO <N
0 0
6
<N
O O
3
o
<N
0 0
<N
Gandak
/
Madhubani
Muzaffarpur
: % < • J " . I
• i • • •
rpur
Darbhanga' „
Saharsa
* * .......
O O
3
o
6
<N
N
<N
0 0
<N
0 20 40 80 km
Legend □ Towns
Sample locations ^Bj Mesoproterozoic Sjjjg Neoproterozoic
1 Palaeoproterozoic—Mesoproterozoic I I Archean—Proterozoic
I I Quaternary
84°30'0'' 85°00'0'' 85o30'0" 86°00'0" 86o30'0" E
Fig. 2. Geological map of East Ganga basin with sample location points.
GC in splitless mode with helium as the carrier gas at fixed oven temperature of 28°C. The light h
Для дальнейшего прочтения статьи необходимо приобрести полный текст. Статьи высылаются в формате PDF на указанную при оплате почту. Время доставки составляет менее 10 минут. Стоимость одной статьи — 150 рублей.