>K9m 2014, TOM 146, Bbin. 4 (10), cTp. 741 746
© 2014
INFLUENCE OF THE SPATIAL AND TEMPORAL DISTRIBUTION OF AN INCIDENT LASER BEAM PROFILE ON THE ENERGY DISTRIBUTION OF IONIZED PHOTOELECTRONS
V. M. Petrovic, T. B. Miladinovic*
Department of Physics, Faculty of Science, Kragujevac University 34000, Kragujevac, Serbia
Received May 29, 2014
We discuss the effects of two different spatial and temporal laser beam profiles on the energy distribution of ionized photoelectrons. Two types of profiles of laser radiation, Gaussian and Lorentzian, are considered. The influence of the nonzero initial momentum of ejected photoelectrons is observed. We find that selection of the laser beam profile influences the maximal energy distribution. It is also shown that the nonzero initial electron momentum has a more significant influence for the Lorentzian beam profile.
DOI: 10.7868/S0044451014100083
1. INTRODUCTION
When an intense laser pulse is incident 011 an atom target, it induces ionization via nonlinear processes. I11 this paper, the tunnel regime of ionization is analyzed. The theoretical approach to the tunneling problem is based 011 a single-active-electron approximation, where the idea is that only one electron is involved in the ionization process. Tunneling ionization occurs when the Keldysh parameter 7 = u>\/2E~j/F fl] is less or much less than unity (here, ui and F are the frequency and the strength of the laser field, and is the ionization potential of the atom or the ion); here and hereafter, we use atomic units (e = h = m = 1). The Ammosov Deloiie Ivrainov (ADIv) theory is one of the most widely used theories in this area [2].
Consideration of a spatial temporal distribution of the laser beam contributes to a better understanding of the aforementioned process. I11 this paper, the effect of a spatial temporal profile of the laser beam 011 the energy distribution is analyzed. I11 our previous work, we assumed the Gaussian profile of the laser beam for analyzing the energy distribution of ejected electrons taking their initial momentum and the pondcromotivc correction into account [3]. Here, we use a modified formula for the Gauss distribution [4] and take one more term from the exponential series. Our numerical calE-mail: tanja.miladinovic'&gmail.com
dilations show better agreement with the approximation with a larger number of terms. We also analyze the energy distribution of the ejected electron for the Lorenzian beam profile.
2. THEORY
Gaussian beams are the simplest and often the most desirable type of beam provided by a laser source and allows the highest concentration of light. But although the Gaussian distribution is frequently assumed, there are a few other shapes, such as Lorentzian and flat top, that allow a very uniform distribution of the energy across a given area.
We start with the Gaussian spatial temporal distribution of the laser field intensity in the form [4]
F(p.z.t) = F
[l + (*/*o)T
2 (p/Rf ft
x exp
(1)
where i is the coordinate along the light ray, p is the axial coordinate that is normal to the light ray, R is the radius of the laser beam, ¿0 = irR2/\, A is the laser wave length, t is the emerging time of the ejected electron, r is the laser pulse duration, and F is the amplitude of the laser field strength.
The Gaussian beam equation given by Eq. (1) assumes that the beam conies to its narrowest width
V. M. Petrovic, T. B. Miladinovic
ЖЭТФ, том 146, вып. 4 (10), 2014
(called the beam waist) at j = 0 [5]. Based on these presumptions, we simplify Eq. (1) to
F(p,z,t) = F охр
(2)
This equation can be written with the spatial dependence part expressed in a more general form,
F(p, z.t) = F exp
This modification contains a dimonsionless exponent n. It is obvious that the Gaussian is the special case n = 2, whereas for larger n, the laser beam profile resembles the fiat-top shape [G].
We use the expression for the ionization rate in the framework of the ADK theory [2]. Taking the Gaussian distribution of the laser beam in Eq. (2) into account, we obtain the formula
wadi< = W".IDA- охр
x охр
тр-
3ui 4 (2F)3/'2 3 F
(3)
whore
p is the initial momentum of an ejected electron [7], // is a parabolic coordinate, and in the case where the electron is outside the barrier, > 1/F [8]. Equation (3) corresponds to the second-term expansion of a part of the exponential in Eq. (2).
Usually, the ionization process is saturated, which means that photoelectrons occur inside some definite volume in the laser beam focusing region. In the saturated region, the following condition is satisfied [9]:
W dt > 1.
(4)
The total number of ions produced during the laser pulse grows very rapidly at a certain value of r (in what follows, p), which can be determined to a high degree of accuracy from the condition given by Eq. (4):
Wdt = 1.
(5)
After substituting Eq. (3) into Eq. (5), we obtain p, the radius of the region where saturation of the ionization probability occurs:
3 FR2
Pg-2 =
4(2Fj)3/2
111 U
3TTFT2
ADK
1 9
7'V
4(2Fj)3/2 3u;
(6)
Inside the region defined by p, all atoms are ionized, while outside it, none is ionized.
But as we already noted, the accuracy of the approximation increases if we take more terms from the series of the exponential in Eq. (2) into account. For the third term of the expansion, we obtain
Wлок = Wad а-охр
4(2Fj)3/2
x exp
3 F
EL
R2
(7)
Using the above-mentioned procedure and the integral
exp {^u [(.i:2 + b) + b(b + 2.i:2)] } dx =
exp [—ub( 1 + b)] s/tt sf a + 2 ub
where
и =
4(2 F)3/'2
3 F
Я2'
we obtain from Eq. (7) that
2 ^ Pa?, =
4(2(2Fj)3/2/3F — 1)
( 3 ttF
In U
ADK
2 qV
V4(2Ei)3/2 J 3ui
(8)
With the condition t ~ r\/3F/(2F,)3/2 -С r and according to Rofs. [3,10], the final energy of the ejected electron is
f -i. £1 (_£_
max ~ 2 + 4^2 °xp I R1
(9)
For a Gaussian laser beam, substituting p212 and p213 in Eq. (9) yields
F.°2 =
^max
II
4u/2
1 3 FR2
R2 4(2Ft)3/2
In W,
3ttFt2
adk
lP"
4(2 Ei)3/2 3u;
(10)
>IOT0, TOM 146, Bbin.4(10), 2014
Influence of the spatial and temporal distribution
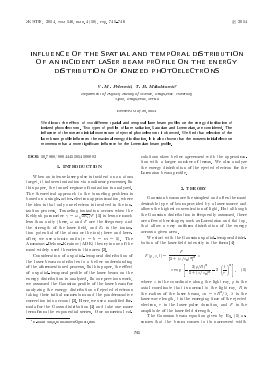
Fig. 1. Dependence of the energy distribution E^ax on the field intensity I = 1014-1016 W/cm2 for a nonzero initial momentum is shown as (a) a 2D graph for the fixed parabolic coordinate r] = 150 and (b) a 3D graph for the parabolic
coordinate r] = 15-150
E,eV 240
160 80
0
Fig. 2. The same as in Fig. 1 for
2 4 6 8 10 /, 1015 W/cm2
F2
Emax — 2 + 4^2 eXP '
K2
R2 4[2(2Ei)3/2/3F — 1]
1 Tj/2
2 7V
(h)
We also studied the energy distribution for a Lorentzian laser beam. Just recently, there has been growing interest in the Lorentz beam since it was introduced by Gawhary and Severini [11]. Several temporal profiles for the Lorentzian distribution can be found and some of them include the Gaussian beam as the core of their spatial profile. However, we have chosen the spatial-temporal distribution of the field strength in the form [12,13]
F(p,z,t) =
1+
(S)!
i+-
(12)
The corresponding ionization rate is
wfn2K = wADK( l + § + ^
2 \ 2n* —3/2
x exp ( —— | exp
2(2E^ ft p 3 F \ t R
(13)
where n* denotes the effective quantum number. By a similar procedure, using the integral
°° 2
J + Y^j exP [~Ka + xf] dx =
— oo
[1 + 2(3 + a2)b] v^F " 6 '
where
_p_ 2(2E^
a~ R> 3F '
we deduce from Eq. (13) that
/, io«W/<
cnr
M. Petrovic, T. B. Miladinovic
>tOT4>, tom 146, Bbin.4(10), 2014
11 150
8 10 I, 1015 W/cm2
Fig. 3. Comparison of (solid line) and (dashed line): (a) a 2D graph and (b) a 3D graph
pL = R2
exp
l + <
[2(2E.f!2
3u
3F
3/2
tWadktt1/2
3-F
4(2^)3/2
-3
• (14)
For the Lorenzian beam shape, the final energy of the ejected photoelectron has the form
E ~P- +
-L^max — -
2 4cj2 1 + (PL2/R)2 '
(15)
r o P2 F2 EL2 = — H--
2 4 uj2
x <
1 +
exp
1 + «
fp>\ [2(2Eif'2 3w
3F
3/2 x
LV
TWadktt1/2
SF
X 4(2^)3/2
-1
(16)
We used only the second-term approximation for this beam shape because the calculation is too complicated for more terms.
3. ANALYSIS
We analyzed the effects of spatial-temporal laser beam profiles on the energy distribution of the ejected photoelectrons for the tunnel ionization process with
7 = 0.3. We chose the pulse profiles to be Gaussian and Lorentzian. The laser beam is a linearly polarized monochromatic plane wave incident along the £ direction. We observed a single ionized atom of argon exposed to the CO2 laser field. The first ionization energy is Ei = 15.96 eV, i.e., Ei = 0.5791 a.u.
The theoretical energy spectrum of the ejected photoelectrons was obtained from Eq. (9) under the assumption that all the electrons were accelerated by the ponderomotive potential in the focal plane and the initial kinetic energy was nonzero. Figure 1 shows the energy distribution of these electrons for the Gaussian laser beam, based on Eq. (10).
Figure 2 presents the result obtained for the third-degree expansion for a Gaussian beam, based on Eq. (11). To complete the picture of the observed effect, we compare these two expansions and obtain the graphs in Fig. 3. As can be seen from Fig. 3a, the shape becomes narrower for E^3ax compared to E^ax. Both graphs first show a rapid energy decrease for some laser field intensity interval; after that, the energy considerably increases up to some maximum value and then decreases for a monotonic increase in the laser field intensity. The E^ax curve decreases much faster than EraL> especially in the higher-energy region, above I « 4 • 10:15 W/cm2. As a result, at higher field intensities, the photoelectron energy spectrum for E^ax lies in the energy range much lower than for E^ax. The maximum energy of the ejected photoelectron of an argon atom is higher for E^ax than for E^ax. It is also shifted to the lower field intensity. The laser field intensity at which the maximum energy is achieved for the Gaussian laser profile is I = 1.91 • 1015 W/cm2, Emlx = 170.868 eV and I = 1.83-1015 W/cm2, Eg3ax = = 285.911 eV. In Fig. 3this dependence
Для дальнейшего прочтения статьи необходимо приобрести полный текст. Статьи высылаются в формате PDF на указанную при оплате почту. Время доставки составляет менее 10 минут. Стоимость одной статьи — 150 рублей.