Pis'ma v ZhETF, vol.91, iss.6, pp. 291-296
© 2010 March 25
Observation of wave energy accumulation in the turbulent spectrum of capillary waves on the He-II surface under harmonic pumping
L. V. AbdurakhimovM. Yu. Brazhnikov, I. A. Remizov, A. A. Levchenko Institute of Solid State Physics RAS, 142432 Chernogolovka, Russia
Submitted 27 November 2009 Resubmitted 10 February 2010
Recent results of the experimental study of capillary turbulence on superfluid helium-4 surface are presented. For the first time wave energy accumulation was observed in the wave turbulent spectrum at high frequencies when the surface was excited by harmonic pumping. We suggest a qualitative explanation of this phenomenon in the frames of weak wave turbulence approach that takes into account discreteness of the eigenfrequencies spectrum of surface oscillations in the cylindrical resonator.
Wave turbulence (WT) is a non-equilibrium state of the weakly nonlinear wave system wherein scales of energy pumping and energy dissipation are well-separated [1]. Examples of this nonlinear phenomenon can be found in diverse fields such as plasma physics, nonlinear optics, ferro-magnetism, and hydrodynamics. In particular, an ensemble of nonlinear capillary waves on the liquid surface is a well-known system in which wave turbulence can be realized. For capillary waves the main processes of the nonlinear interaction are three-wave processes of decay and merging that satisfy the conservation laws of frequency w and wave-vector k: wi + u)2 = u>3, ki + k2 = k3. The WT theory predicts that direct turbulent cascade is formed in the iner-tial range between the energy pumping scale and energy dissipation scale with the wave spectrum described by power law function of frequency (Kolmogorov-Zakharov spectrum). In recent years, due to the development of technical equipment and computational tools for data processing, capillary turbulence has been in focus of experimental studies of capillary waves on the surface of water [2-4], ethanol [4], silicon oil [5] and mercury [6]. Our previous experiments [7, 8] showed that the use of quantum fluids (liquid 4He and liquid hydrogen) for investigations of capillary turbulence can provide additional advantages with respect to traditional liquids due to their low viscosity. In the present paper we focus on the peculiarities of the shape of the turbulent wave energy distribution at high frequencies observed in experiments with He-II, a superfluid phase of liquid 4He (preliminary results were published in [9]). For the first time we observed that under certain conditions a deviation from the power law spectrum is formed at frequencies of the order of the viscous cut-off scale. We also suggest a qualitative model of this phenomenon that takes
1) e-mail: abdurl0issp.ac.ru
into account the influence of discreteness arising due to the finite sizes of the experimental cell.
In the reported experiments with superfluid 4He we used the similar technique as in our previous studies of capillary turbulence on the surface of liquid hydrogen [10]. The measurements were made at temperature T « 1.7 K (for comparison, the temperature of the normal- to-superfluid state transition for liquid 4 He at saturated vapor pressure is equal to T\ = 2.17K). At this temperature superfluid helium has kinematic viscosity v = 8.9 • 10-5cm2/s, density p = 0.145g/cm3, surface tension a = 0.32 din/cm [11]. Liquid helium was condensed into a copper cup of inner diameter D = 30 mm and depth 4 mm. At the bottom of the cup a radioactive thin plate was placed. Emitted from the plate /3-electrons ionized 4He atoms which led to formation of positively charged ions and electrons. Between the cup and the upper electrode (a copper plate placed in vapor at a distance of 3 mm above the liquid surface) constant DC voltage U « 600 V of appropriate polarity was applied, so that the liquid surface was charged by positive ions. By applying low-frequency AC voltage with amplitudes from 1 up to 20 V to the cup, in addition to DC voltage, the capillary waves were excited on the charged surface. The advantage of this method of wave pumping is that the surface is excited directly by the driving force, but not through an instability as in the experiments with parametrically excited waves [2, 4, 5] and not by blade-wavemakers as in [6] which probably resulted in any motion in the bulk. Oscillations of the surface were detected by measurements of the power of the laser beam reflected from the surface. The laser beam fell on the surface at sliding angle a «0.15 producing an elliptic spot of size lmmx7mm. Typical wavelengths of capillary waves in the experiments were smaller than the spot dimensions. The laser beam reflected from the oscillating surface was focused
IlHCbMa b ?K3T<J> tom 91 Bbin.5-6 2010
291
5*
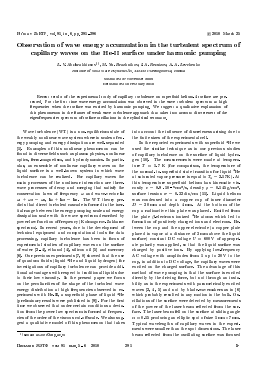
100 1000 ro/2rn (Hz)
Fig.l. Turbulent spectrum of capillary waves on the He-II surface (T = 1.7 K) obtained when the surface was pumped by sinusoidal force with frequency 80 Hz, amplitude of pumping voltage 11 V. The dashed line corresponds to power law Pj ~ w-3'7 predicted by the theory for narrow-band pumping
by the lens on a Si photodiode (Hamamatsu s3590-08). Time variations of the signal from the photodiode were amplified by a SR570 amplifier and then digitized by a 24-bit analogue-to-digital converter Leonardo-II [12] with discretization frequency 102.4 kHz. Obviously, the amplified signal from the diode was proportional to the time variations of the reflected laser beam power P(t). Signal P(t) was recorded to the hard disk into the series of 16 files of approximately 5 seconds long each. From Fast Fourier Transform (FFT) of every data file, power spectrum |PW|2 was computed, and averaging was performed over all the 16 files. As it was shown in our previous works (see, for example, [8, 10]) the reflected laser beam power spectrum |PW|2 was proportional to the spectrum of the correlation function of surface elevation iw = \t)u\2, hence |PW|2 ~ |r/„|2.
In the reported measurements two types of low-frequency driving force were used. In the first type experiments the surface was driven by a sinusoidal force with frequency wpump that was equal to one of resonant frequencies of the cell. In the measurements of the second type driving by a noisy force was used. In this case the electrical noise was produced by a programmable noise generator.
Fig.l shows the turbulent spectrum of capillary waves Pj obtained in our experiments when the surface was pumped by AC voltage at frequency 80 Hz and amplitude 11V. Turbulent distribution Pj looks similar to that observed earlier in our experiments on the surface of liquid hydrogen [7] and in our first experiments
on the surface of liquid 4He [8]. The spectrum consists of equidistant harmonics: the first harmonic frequency corresponds to the pumping frequency, while other harmonics are generated due to the nonlinear interactions at frequencies multiple to the pumping frequency. In the inertial range the amplitudes of the harmonics depend on frequency as power law function Pj ~ with index 97?. ~ 3.7 which is in accordance with the theoretical prediction for narrow-band pumping [13]. At frequencies of about 4 kHz the wave amplitudes were reduced significantly due to viscous dissipation and tended to the level of instrumental noise.
When the amplitude of pumping was decreased to 10 V, the shape of the turbulent spectrum was changed (Fig.2). The high-frequency edge of the turbulent cascade shifted towards low frequencies which was in accordance with our previous experiments [8, 14]. But a new phenomenon was observed, namely formation of a well pronounced local maximum in the wave amplitudes at frequencies of the order of high-frequency edge of turbulent cascade wj (shown by the dashed curve in Fig.2). With further reduction of the pumping amplitude, the local maximum shifted towards low frequencies. Eventually, at very low pumping amplitudes the spectrum consisted only of a few harmonics, and no local maximum was found.
Formation of a local maximum was seen in a number of experiments with harmonic pumping. The common feature observed in the experiments was that the local maximum was formed near the high-frequency edge
10 101 10
12
10
§
i
ts £
10 108 10" 106 105
10 1000 100
100
1000
ro/2rn (Hz)
Fig.2. Turbulent spectrum after reduction of pumping amplitude. Frequency of pumping 80 Hz, amplitude of pumping voltage 10 V. At frequencies of about 2.5kHz a local maximum is observed (emphasized by dashed curve). The dashed straight line corresponds to Pj ~ w-3'7
12
10
§
ts £
10 101 10 109 108 107 106 105 104 1000 100 10 1 0.1
10
100
1000
ro/2rn (Hz)
104
Fig.3. Turbulent spectrum in the case of pumping at (¿>pump/27r = 34 Hz. Formation of a maximum at the spectrum is clearly seen on the main plot (circled) and in the inset on an enlarged scale
of the turbulent cascade although the shape of the local maximum and its exact position depended on the pumping frequency as well as on the pumping amplitude. For example, when the surface was pumped by the sinusoidal force at 34 Hz, the wave spectrum with a distinct local maximum was obtained (Fig.3). However, the local maximum was located in the dissipation region of turbulent distribution rather than in the inertial range as it is shown in Fig.2.
In the case of noisy pumping, we never observed a local maximum. To illustrate this, in Fig.4 we present a turbulent distribution obtained when the surface was pumped by a noisy signal in the frequency range GO-ISO Hz. The amplitude of pumping force was chosen so that the high-frequency edge of inertial interval was located approximately at those frequencies at which it was seen in Figures 2,3. The spectrum differs dramatically from the spectra observed in the experiments with
10 101 10
12
10
§
1
10 108 107 106
105 104 1000 100
• I
1
! â
1 i|uj|l,||| ' H
!
:
!
!
100 1000 r
Для дальнейшего прочтения статьи необходимо приобрести полный текст. Статьи высылаются в формате PDF на указанную при оплате почту. Время доставки составляет менее 10 минут. Стоимость одной статьи — 150 рублей.