ОПТИКА И СПЕКТРОСКОПИЯ, 2014, том 117, № 4, с. 570-576
СПЕКТРОСКОПИЯ КОНДЕНСИРОВАННОГО СОСТОЯНИЯ
y%K 535.33
PHYSICAL AND OPTICAL PROPERTIES OF Li2O-MgO-B2O3
DOPED WITH Dy3+
© 2014 r. M. H. A. Mhareb*, S. Hashim*, A. S. Sharbirin*, Y. S. M. Alajerami*, **, R. S. E. S. Dawaud*, and N. Tamchek***
* Department of Physics, Universiti Teknologi Malaysia, 81310 Skudai, Johor, Malaysia ** Department of Medical Radiography, Al-Azhar University, Gaza Strip, Palestine *** Department of Physics, Faculty of Science, University Putra Malaysia, 43400 UPM Serdang, Selangor
E-mail: mmhareb@hotmail.com Received February 22, 2014
The study on the optical properties of alkali borate glasses doped with rare earths is an interesting area of research. Dysporosium doped lithium magnesium borate glasses were prepared by melt-quenching technique with dysporosium concentration varying from 0.3 to 1.0 mol%. Physical and optical properties of Lithium Magnesium Borate doped with different concentration of Dy3+ were observed based on its physical parameters, emission spectra and absorption spectra. Furthermore, the absorption spectra of this study exhibits eight absorption bands with hypersensitive peak at 1260 nm (H^). Moreover, two emitted spectra transitions were also observed at 4^9/2 —»- 6Hj5/2, AF9/2 —► 6Hj3/2. Lastly, important physical parameters for each concentration of dopant such as density, ions concentration, polaron radius, inter-nuclear distance, refractive index, oscillator strength and other parameters were determined.
DOI: 10.7868/S003040341410016X
1. INTRODUCTION
2. MATERIALS AND METHODS
Borate glass has attracted great interest among researchers in optical materials because of its high thermal stability, high transparency, low melting point and good solubility of rare earth. The rare-earth (RE) elements have several advantages to enhance the light emission and their ability to create a wide spectral range. This means that the glass sample that is doped with rare-earth elements has diverse optical properties which are important in solid state laser applications [1-3].
In recent years, many studies have been carried out to investigate the rare-earth based optical devices [4-6]. Glass material doped with Dy3+ has been further investigated because of its capability to emit white light emission. The luminescence spectra of Dy3+ are most intense on two bands in the visible spectral region, which are 4F9/2—6H15//2 (blue) and 4F9/2-6H13/2 (yellow) transitions [7-9]. The white light emission can be obtained by either changing the excitation wavelength or by varying the ion concentration.
To the best of our knowledge, RE doped borate glasses have not been study in great detail. In the present work, we have prepared Li2O-MgO-B2O3 doped with of dysprosium oxide (Dy3+) and have studied the effects of Dy3+ concentration on physical and optical properties.
2.1. Sample Preparation
Dy3+ doped lithium magnesium borate glasses were prepared by melt-quenching technique. The raw materials used to glass making are the lithium oxide (Li2O), magnesium oxide (MgO), borate oxide (B2O3) and dysprosium (III) oxide (Dy2O3). The materials were chosen in fine powder with 99.99% purity (Aldrich Company). After weighting the raw material according to the specific percentages, the reagents are well mixed for an hour to prepare batch of 15 g.The mixtures are melted in alumina crucible in an electronic furnace for an hour at a temperature of ~1100°C. The melt was stirred frequently to get a bubble free liquid. Then, the mixture was poured inside a steel mould and pressed quickly using a steel plate to form the glass sample. The mixture was subsequently annealed at 400°C temperature for 3 hours, then reduce gradually to room temperature to remove thermal and mechanical stress. The glass compositions with different dopant concentrations are listed in Table 1.
2.2. Instrumentation and Parameters
2.2.1. X-ray diffraction (XRD). The amorphous state of the samples is proved by a Siemens Diffracto-meter D5000 equipped with software analysis and CuZa radiation (X = 1.54 Â) operating at 40 kV,
Table 1. Details of the compositions of the glass samples
Table 2. DTA studies of LMB with different dopants con-
Glass Chemical composition (mol. %) centrations
Sample number Tg (°C) Tc (°C) Tc - Tg (°C) Hr T J-rg
LÎ2O B2O3 MgO Dy2O3
Pure 30.0 60.0 10.0 0.0 S1 500 595 95 0.38 0.59
0.3% 30.0 59.7 10.0 0.3 S2 507 608 101 0.41 0.60
0.5% 30.0 59.5 10.0 0.5 S3 510 612 102 0.41 0.59
0.7% 30.0 59.3 10.0 0.7 S4 511 598 87 0.32 0.59
1.0% 30.0 59.0 10.0 1.0 S5 514 596 82 0.30 0.59
30 mA, with 20 from 10° to 90°, in steps of 0.05° and 1 s counting time per step.
2.2.2. Fourier transform infrared spectroscopy (FTIR).
The functional areas of the current compositions were analyzed based on the Fourier Transform Infrared (FTIR) analysis. A Perkin Elmer model was specified to analyze the prepared glasses. To optimize the present analysis, the samples were carefully ground, mixed with KBr powder and pressed with 7 tons pressure to form thin pellets (3 mm diameter and 1 mm thickness). The IR scans were scanned with a wave number limited to 4400—400 cm-1 and instrument resolution of 0.8 cm-1 with three time repetitions at each scan.
2.2.3. Differential thermal analysis. At room temperature the differential thermal analysis of the current samples was performed by using PerkinElmer, Pyris Diamond diffractmeter fitted with copper target and nickel filter, operated at 40 kV, 30 mA.
2.2.4. UV-VIS-NIR Measurement.
2.2.4.1. Optical absorption. The optical absorption spectra of the glass bulk are recorded at room temperature using Shimadzu 3101 spectrometer in the range of200-2000 nm (UV-VIS-NIR). The results were an-
alyzed using double monochromatic diffraction grating system and photomultiplier R-928 detector with resolution of ~0.1 nm. For each sample, absorption spectra will be obtained to get the peaks and band gaps. The absorption peaks and band assignments will be obtained from the absorption spectra of each sample.
2.2.4.2. Optical band gap. The formula was introduced by Tauc in 1966 to define the absorption edge and the shape in regions with high optical absorption properties [10]
a(rn) =
(h ( (p ) vEK ) "A
h(() v
(1)
where a(œ) is the absorption coefficient for direct and
indirect transitions based on the value of n (1 for di-
2
rect transition and 2 for indirect transition), ® is the angular frequency, A is a constant related to the extent of the band tailing and Eg is the optical energy gap.
2.2.4.3. Refractive index measurement. The refractive index is one of important optical properties for
Counts, a.u. 400 200 0
400 200 0
400 200 0
600 400 200 0
0.3%
^^^ 0.5%
^ékM^^^^........ 0.7%
1.0%
1 1 1 1 1 1 1 1
10
20
30
40
50
60
70
80
29, deg
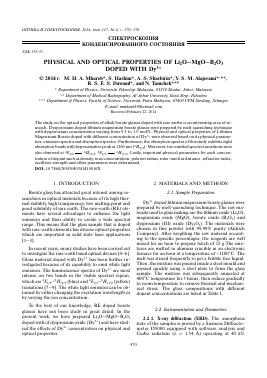
Fig. 1. XRD spectrum obtained for Li2O-MgO-B2O3 doped with 0.3, 0.5, 0.7, 1.0 mol. % of Dy
-50 -
EXO
-100 -
ENDO
-150 -200
500 600 700 800 900
Temperature, °C
Fig. 2. DTA results of analysis of LMB: 0.5 mol. % of Dy
3+
glass. The refractive index can be calculated using Eq. (2) [11]
n
1
n1 + 2
= i - p,
4 20
where Eg is the direct energy band gap.
(2)
where e( v) is the molar absorption coefficient at a given energy v (cm-1).
fexp = 4.32 X 10"9 Ja v,
(4)
where A v (cm *) is the width of the band at half of the peak intensity.
2.5. Oscillator Strength
The oscillator strength is the intensity of spectral lines absorbed by the glass sample. Two formulas can be used to determine the oscillator strength which depends on the shape of the absorption peaks [12]. Eq. (3) which is obtained from the Beer-Lambert Law is used for these absorption peaks with Gaussian shape, whereas Eq. (4) is used for the other shapes.
fexp = 4.32 X 10
-9
Js( v ) dv,
(3)
2.6. Photoluminescence Spectra
Photoluminescence (PL) spectrum was measured using Perkin-Elmer LS55 Luminescence Spectrometer. The sample was put in a holder and was scanned from 200 to 2000 cm-1 at room temperature. The bulk glass samples were excited using xenon discharge lamp (300 < X < 1300 nm). The luminescence signal was analyzed using a Monk-Gillieson type monochromator equipped with a photodiode detector at a particular excitation wavelength.
Transmittance, %
Fig. 3. IR spectra of Li2O-MgO-B2O3 doped with 0.3, 0.5, 0.7, 1.0 mol. % of Dy3+.
(ahœ)1/2, (eV Cm)1/2
01-'-'-1
2.5 3.0 3.5 4.0
hœ, eV
Fig. 4. Direct band gap of Li2O-MgO-B2O3 doped with 0.3, 0.5, 0.7, 1.0 mol. % of Dy3+.
Table 3. Physical properties of Li2O-MgO-B2O3 glasses doped with Dy3+
Measurement
Doped (Dy3+)
0.3% 0.5% 0.7% 1.0%
Average molecular weight, M (g mol-1) 59.643 60.389 61.135 62.254
Density, p (g cm-3) 2.317 2.342 2.373 2.413
Molar volume (cm3 mol-1) 25.742 25.785 25.762 25.8
Ion concentration N x 1021 (Ion cm-3) 7.016 11.673 16.357 23.333
Polaron radius, rp (À) 2.016 1.777 1.588 1.410
Inter-nuclear distance, ri (À) 5.224 4.408 3.940 3.400
Field strength, F x 1015 (cm2) 6.770 9.506 11.902 15.084
Refractive index for direct, n 2.377 2.389 2.397 2.401
Cutoff wavelength, nm 418 416 418 414
Direct optical band gap, eV 3.066 3.038 3.01 2.99
Indirect optical band gap, eV 3.44 3.39 3.36 3.35
2.7. Physical Parameters
2.7.1. Density and molar volume. By using the Archimedes method, the density of the glass sample was obtained. The fluid used for the measurement is Toluene (99.99% purity). Toluene is chosen because it is not easily absorbed by the glass sample. For all samples, the measurement was repeated three times at a room temperature.
P
A x 0.865 g/cm3,
(5)
A - B
whereby A is the weight of glass in the air and B is the weight of glass in the immersion liquid Toluene. The density of toluene is 0.865 g cm-3 at room temperature (27°C).
Meanwhile, to calculate molar volume Vm, the following formula is used
V =
M( cm
mol
(6)
(aho)2, (eV Cm)
1000 -
800 -
600 -
400 -
200 -
0
2.5
3.0
3.5
Для дальнейшего прочтения статьи необходимо приобрести полный текст. Статьи высылаются в формате PDF на указанную при оплате почту. Время доставки составляет менее 10 минут. Стоимость одной статьи — 150 рублей.