ЖУРНАЛ АНАЛИТИЧЕСКОЙ ХИМИИ, 2012, том 67, № 12, с. 1079-1083
ОРИГИНАЛЬНЫЕ СТАТЬИ
УДК 543
SIMULTANEOUS DETERMINATION OF FERULIC ACID, HESPERIDIN, 6-GINGEROL AND GLYCYRRHIZIN IN INSAMPAEDOK-SAN BY HPLC COUPLED WITH DIODE ARRAY DETECTION © 2012 г. Jin Bae Weon1, Jin Yeul Ma3, Hye Jin Yang1, Choong Je Ma1, 2
department of Biomaterials Engineering, Division of Bioscience and Biotechnology, Kangwon National University
Chuncheon, 200-701 Korea 2Research Institute of Biotechnology, Kangwon National University Chuncheon, 200-701 Korea 3TKM Converging Research Division, Korea Institute of Oriental Medicine 483 Exporo, Yuseong-gu, Daejeon, 305-811 Korea Received 30.11.2010; in final form 07.04.2011
For the simultaneous determination of ferulic acid, hesperidin, 6-gingerol and glycyrrhizin in Insampaedok-san, one of traditional oriental medicine prescription, a high performance liquid chromatography (HPLC) analytical method was developed. The separation was achieved on a SHISEIDO C18 column (S — 5 p.m, 4.6 mm I.D. x 250 mm). The mobile phase consisted of water with 0.1% trifluoroacetic acid and methanol in gradient elution at a flow rate of 1.0 mL/min. The UV wavelength was set at 250, 280 and 320 nm. The method was validated for linearity, precision and recovery. All calibration curves showed good linear regression (r2 > 0.9994) over the wide test ranges. LOD (limit of detection) and LOQ (limit of qualification) ranged from 0.02 to 0.14 p.g/mL and 0.05 to 0.42 p.g/mL, respectively. The relative standard deviation (RSD) of the intra- and inter-day test, precision test were within 2.26 and 2.45%, respectively, with accuracy from 95.95 to 108.22%. The recoveries of the four compounds were obtained between 94.30 and 106.34% with RSD less than 1.96%. The verified method was successfully applied to quality control of Insampaedok-san.
Keywords: simultaneous determination, Insampaedok-san, high performance liquid chromatography (HPLC), diode array detector (DAD), marker constituents, validation.
According to the WHO, in some Asian countries, most people depended on traditional herbal prescription for the treatment of the disease. Traditional herbal prescription had a few side effects and was safe. Therefore it was effective in health care. Traditional prescriptions were made from a few or many plants. The remedial effect of traditional prescription was based on interaction of many compounds in individual medicinal plants. To evaluate the safety and effectiveness of traditional prescription, quality control of compounds in traditional prescription was required [1, 2]. Generally, chromatography and related techniques were applied to the quality control of many herbs [3]. The use of high-performance liquid chromatography (HPLC) has been increased to evaluate the quality of medicinal plants. Usually, analytical methods of compounds were individual methods. It was inefficient that individual methods were applied to traditional prescription containing many herbs. Thus simultaneous quantitative determination of many compounds was required. Many simultaneous analysis methods for compounds of these traditional prescriptions and herbs were reported [4—7].
Insampaedok-san was a well-known Korean traditional oriental medicine for treatment of cold related symptoms. Effects of Insampaedok-san on the analgesia and antipyresis were reported [8]. Insampaedok-san contained 12 herbs, Lonicera japonica Thunberg, Forsythia viridissima Lindley, Schizonepeta tenuifolia Briquet, Saposhnikovia divaricata Schiskin, Panax ginseng, Bupleurum falcatum Linne, Angelica decursiva Franchet et Savatier, Ostericum koreanum Maximow-icz, Aralia continentalis Kitagawa, Citrus aurantum Linne, Playtcodon grandflorum, Cnidium officinale Makino, Poria cocos Wolf, Glycyrrhiza uralensis Fischer, Zingiber officinale Roscoe and Mentha arvensis Linne var.
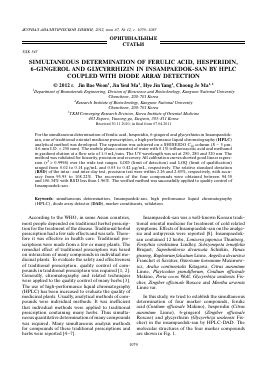
In this study, we tried to establish the simultaneous determination of four marker compounds, ferulic acid (Cnidium officinale Makino), hesperidin (Citrus aurantum Linne), 6-gingerol (Zingiber officinale Roscoe) and glycyrrhizin (Glycyrrhiza uralensis Fischer) in the insampaedok-san by HPLC-DAD. The molecular structures of the four marker compounds are shown in Fig. 1.
O
H3C H3C
H
Ferulic acid
OH
OH O
Hesperidin
HOOC
I V \
HO' HO HOOC.
HO' HO
O
O^ OH
COOH
O OH
Glycyrrhizin
HO
OCH3
6-Gingerol
Fig. 1. Chemical structures of ferulic acid, hesperidin, 6-gingerol and glycyrrhizin.
EXPERIMENTAL
Chemicals and reagents. HPLC grade solvents, methanol and water were purchased from J.T. Baker (USA). Analytical grade trifluoroacetic acid (TFA) was obtained from DAE JUNG (Korea). Ferulic acid was purchased from Sigma (USA). 6-Gingerol, gly-cyrrhizin and hesperidin were purchased from Korea Food & Drug Administration. The purities of four standard compounds were greater than 98%.
Chromatographic system. The HPLC analyses were conducted using a Dionex Ultimate 3000 system (Germany) equipped with a pump (LPG 3X00), an auto sampler (ACC-3000), a column oven (TCC-3000SD) and diode array UV/VIS detector (DAD-3000(RS)). System control and data analyses were executed by Dionex ChromelonTM Chromatography Data System. To obtain a suitable separation column, various columns were tested, including a SHISEIDO C18 column (5 ^m, 4.60 mm I.D. x 250 mm), a LUNA C18 column (5 ^m, 4.60 mm I.D. x 250 mm) and XTerra™ RP18 (5 |m, 4.60 mm I.D. x 250 mm). As a result of test, separation was achieved on a SHISEIDO C18 column (5 |m, 4.60 mm I.D. x 250 mm) successfully. The column oven temperature was set at 35°C. The mobile phase consisted of methanol (A) and water with 0.1% TFA (B) at a flow rate of 1 mL/min. In order to obtain the chromatograms with better resolu-
tion, different type of gradient systems of the mobile phase were tested. According to the results of test, the mobile phase system used was a gradient of solvent A and solvent B as follows; 0—10 min, 20% A; 10—15 min, 30% A; 15-40 min, 30-40% A; 40-45 min, 40-60% A; 45-55 min, 60-70% A; 55-60 min, 70% A. The DAD spectra were recorded between 190 and 400 nm. The sample injection volume was 20 |L.
Preparation of standard solutions. The standard compounds were accurately weighed and dissolved in 60% methanol to prepare the stock solutions of ferulic acid (200 |g/mL), hesperidin (130 |g/mL), 6-gin-gerol (106 |g/mL) and glycyrrhizin (128 |g/mL). The stock solutions were diluted to different concentration ranges for the establishment of calibration curve and conduction of method validation. All stock and working standards solutions were stored at 4°C.
Preparation of sample solution. The powder of the Insampaedok-san (3.0 g) was obtained from the Korea Institute of Oriental Medicine. For the preparation of the Insampaedok-san sample, 175.2 mg of Insampae-dok-san powder was weighed accurately and dissolved in 10 mL of 60% methanol. This sample solution was stored at 4°C and filtered through a 0.45 |m membrane filter before HPLC analysis.
SIMULTANEOUS DETERMINATION OF FERULIC ACID, HESPERIDIN
Table 1. Data from calibration curves of four compounds linear range (LOD and LOQ)
1081
Compounds Linear range, p.g/mL Regression equation (n = 3) r2 LOD, ^g/mL LOQ, ^g/mL
Ferulic acid 0.5 ~ 40 Y = 1.5682x - 0.3112 0.9994 0.02 0.05
Hesperidin 0.33 ~ 26 Y = 0.7166x + 0.0731 1.0000 0.07 0.22
6-Gingerol 0.27 ~ 21.2 Y = 0.1646x - 0.0054 1.0000 0.14 0.42
Glycyrrhizin 0.8 ~ 160 Y = 0.1923x - 0.011 1.0000 0.10 0.31
Notes: n — number of samples analyzed; Y — peak area; x — concentration (^g/mL).
Method validation. Validation of HPLC method was executed according to the ICH guidelines by determination of the linearity, precision and recovery.
Calibration curves, limits of quantification and detection. In order to obtain the calibration curves, the working solutions of six different concentrations of each marker compound were prepared from the stock solutions by diluting with 60% methanol. Six concentration solutions were analyzed in three consecutive injections. The calibration curve was plotted by using the ratio of the peak areas (y-axis) and concentration of compound (x-axis). Calibration curve was used to obtain the regression equation of four compounds. In regression equation Y = ax + b, x is referred to the concentration of marker compounds, Yis peak area, a is slope of calibration curve and b is intercept of calibration curve. Correlation coefficient (r2) value indicated linearity.
Precision and accuracy. To evaluate the precision of the HPLC method, inter-day and intra-day tests were executed by the three different concentrations of mixture standard solution. Inter-day test was conducted by analyzing the standard solutions in five times on three sequential days (1, 3, 5 days). The intra-day test was conducted by analyzing in five times the same standard solutions within 1 day. The amounts of each component were measured from the corresponding calibration curve. Precision was evaluated by the relative standard deviation (RSD) value [RSD = = (standard deviation (SD) / mean measured amount) x 100]. The accuracy of the method was determined by measurement of recovery. The recovery test of the four compounds was performed using samples with three different concentrations of mixed standard solutions. The solutions were injected three times. The recovery (%) was measured from the equation (the amount from Insampaedok-san sample and added standard — amount from Insampaedok-san sample) / the amount from added standard x 100 [9].
RESULTS AND DISCUSSION
Optimization of the HPLC condition. Optimal separation conditions were obtained through different mobile phases with C18 column. Various compositions of mobile phase, pure water/methanol, pure water/ac-etonitrile, 0.1% TFA water/methanol and 0.1% TFA
water/acetonitrile were tried. As result, 0.1% TFA water and methanol was chosen as the best mobile phase. The column temperature was changed and tested in the range from 20 to 40°C.
Для дальнейшего прочтения статьи необходимо приобрести полный текст. Статьи высылаются в формате PDF на указанную при оплате почту. Время доставки составляет менее 10 минут. Стоимость одной статьи — 150 рублей.