EHOXOrHH BHYTPEHHMX BOÑ, 2007, № 3, c. 73-80
THE USE OF FISH COMMUNITY STRUCTURE AS A MEASURE OF ECOLOGICAL DEGRADATION: A CASE STUDY IN TWO TROPICAL
RIVERS OF INDIA
© 2007 D. Chakrabarty*, S. K. Das**
* Department of Zoology, Krishnagar Govt. College, Krishnagar-741101, West Bengal, Nadia, India, e-mail: dibyendu_sanjib@yahoo.co.in ** Netaji Subhas Open University, 1, Wood Burn Park, Kolkata-700020, India
Received 29.05.2006
Fish community structure and water chemistry of two tropical rivers of West Bengal, an eastern province of India, were studied for 2 annual cycles (January 2003 - December 2004) and a higher degree of pollution was found in the Churni River than in the Jalangi River. This was reflected in the water quality as well as in fish community structure of the rivers. It was observed that 63.6% of fish species appeared to have been eliminated from the polluted Churni River since 1983 in 20 years. For protection of fish biodiversity and enhancement of fish production, a rational management program should be implemented for the river Churni.
INTRODUCTION
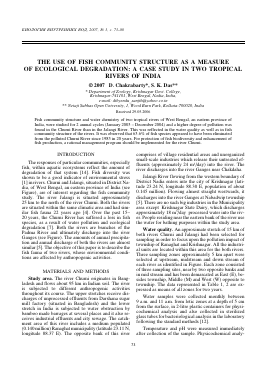
The responses of particular communities, especially fish, within aquatic ecosystems reflect the amount of degradation of that system [14]. Fish diversity was shown to be a good indicator of environmental stress [1] in rivers. Churni and Jalangi, situated in District Nadia, of West Bengal, an eastern province of India (see Figure), are of interest regarding the fish community study. The river Jalangi is situated approximately 25 km to the north of the river Churni. Both the rivers are situated within the same climatic area and had similar fish fauna 22 years ago [4]. Over the past 1520 years, the Churni River has suffered a loss in fish species, as a result of water pollution and ecological degradation [7]. Both the rivers are branches of the Padma River and ultimately discharge into the river Ganges (see Figure). The amounts of annual precipitation and annual discharge of both the rivers are almost similar [5]. The objective of this paper is to describe the fish fauna of two rivers, whose environmental conditions are affected by anthropogenic activities.
MATERIALS AND METHODS
Study area. The river Churni originates in Bangladesh and flows about 95 km in Indian soil. The river is subjected to different anthropogenic activities throughout its course. The upper stretches receive discharges of unprocessed effluents from Darshana sugar mill factory (situated in Bangladesh) and the lower stretch in India is subjected to water obstruction by bamboo made barrages at several places and it also receives industrial effluents and city sewage. The catchment area of this river includes a medium populated (0.140 million) Ranaghat municipality (latitude 23.11 N, longitude 88.37 E). The opposite bank of this river
comprises of village residential areas and unorganized small-scale industries which release their untreated effluents (approximately 24 m3/day) into the river. The river discharges into the river Ganges near Chakdaha.
Jalangi River flowing from the western boundary of District Nadia enters into the city of Krishnagar (latitude 23.24 N, longitude 88.30 E, population of about 0.145 million). Flowing almost straight westwards, it discharges into the river Ganges at Nabadwip township [5]. There are no such big industries in the Municipality area except Krishnagar State Dairy, which discharges approximately 18 m3/day processed water into the river. People residing near the eastern bank of the river use the water for bathing purposes within the study area.
Water quality. An approximate stretch of 15 km of both rivers Churni and Jalangi had been selected for sampling in order to focus upon the pollution impact of township of Ranaghat and Krishnagar. All the industrial units are located within this area for the both rivers. Three sampling zones approximately 5 km apart were selected at upstream, midstream and down stream of each river as identified in Figure. Each zone consisted of three sampling sites, near by two opposite banks and in mid stream and has been demarcated as East (E), besides township, Middle (M) and West (W) opposite to township. The data represented in Table 1, 2 are expressed as means of all zones for two years.
Water samples were collected monthly between 9 a.m. and 11 a.m. from lotic zones at a depth of 5 cm from the surface, in 2-litre plastic containers for physi-cochemical analysis and also collected in sterilized glass tubes for bacteriological analysis in the laboratory following the standard methods [12].
Temperature and pH were measured immediately after collection of the sample. Physicochemical analy-
ses for conductivity, dissolved oxygen (DO), initial biological oxygen demand (BOD), total dissolved solids (TDS), total alkalinity, total hardness, phosphorus, and total nitrogen were performed in the laboratory on same day or within a week. Analyses of all parameters were done following the standard methods [12, 13].
Collection of fish community data. Fish catches at weekly intervals were identified to species, at each sampling site in each river using a pre-tested interview schedule with local fishermen from fish landing stations up to 25 km for both rivers. The fish capturing sites were adjacent to our sampling zones. Fish were identified, when collected by local fishermen. The nets
used for fishing were drag nets with floaters and sinkers. The drag nets used were 25 m in length and 5 m in width. The fishing efforts were almost same in all the sampling zones. A number of representative fish caught by the fishermen were fixed in formalin and transported to the laboratory for study. A set of indicators (species richness, trophic structure, habitat orientation, maximum weight of specimens captured and mean annual fish production) were also examined.
Trophic structure was analyzed as follows. Various members of a fish community are classified into trophic groups based on feeding habits [3, 10]. Analyzing the gut content we found four types of "trophic level" fish-
Table 1. Mean monthly variation of grand average values of some physicochemical characteristics from different zones comprising three sites on the Churni River
Parameter Jan Feb Mar Apr May Jun Jul Aug Sep Oct Nov Dec
Temperature, °C 20 22 25 29 30 29 28 28 29 29 26 24
± 0.51 ± 0.54 ± 0.53 ± 0.69 ± 0.56 ± 0.65 ± 0.55 ± 0.59 ± 0.67 ± 0.74 ± 0.68 ± 0.77
pH 8.14 8.40 8.32 8.15 8.32 8.30 8.10 8.09 8.31 8.42 8.00 8.12
± 0.16 ± 0.19 ± 0.14 ± 0.20 ± 0.16 ± 0.18 ± 0.20 ± 0.15 ± 0.18 ± 0.14 ± 0.16 ± 0.19
Conductivity, 595.4 581.8 651.8 702 640.6 410.2 520.0 510.3 419.9 279.8 467.8 503.6
|S/cm ± 15.6 ± 18.6 ± 16.2 ± 11.3 ± 17.5 ± 10.1 ± 15.4 ± 13.7 ± 15.6 ± 19.2 ± 20.5 ± 18.3
Total solids, 493.3 540.0 508.8 582.2 503.3 247.7 365.3 335.3 320.9 274.1 443.3 495.5
mg/l ± 18.6 ± 15.3 ± 17.8 ± 20.8 ± 23.9 ± 19.4 ± 24.8 ± 18.9 ± 16.7 ± 20.4 ± 23.7 ± 19.9
Total alkalinity, 390.4 410.0 437.6 370.2 377.8 290.0 347.2 283.3 223.9 196.5 423.3 353.2
mg/l ± 17.3 ± 15.8 ± 18.6 ± 20.3 ± 16.5 ± 19.9 ± 15.4 ± 17.8 ± 19.5 ± 20.8 ± 16.9 ± 18.5
Total hardness, 229.2 319.6 234.4 273.7 196.7 147.7 177.0 173.3 166.8 156.6 281.3 232.4
mg/l ± 15.8 ± 18.3 ± 16.5 ± 19.6 ± 17.9 ± 20.8 ± 16.7 ± 19.4 ± 15.2 ± 17.5 ± 19.8 ± 16.3
Dissolved oxygen, 4.80 4.70 4.78 4.76 4.77 4.50 4.30 4.02 3.00 3.10 4.90 4.85
mg/l ± 0.65 ± 0.67 ± 0.71 ± 0.69 ± 0.68 ± 0.66 ± 0.76 ± 0.69 ± 0.77 ± 0.80 ± 0.67 ± 0.76
Biological oxygen 3.24 2.66 3.18 2.35 2.99 3.51 2.53 2.73 2.86 2.93 4.80 2.93
demand, mg/l ± 0.43 ± 0.65 ± 0.59 ± 0.74 ± 0.68 ± 0.79 ± 0.49 ± 0.66 ± 0.67 ± 0.55 ± 0.48 ± 0.77
Total Nitrogen, 4.04 3.89 4.53 5.70 5.55 4.36 3.61 3.49 3.31 4.39 4.43 4.18
mg/l ± 0.08 ± 0.06 ± 0.09 ± 0.07 ± 0.06 ± 0.05 ± 0.08 ± 0.09 ± 0.10 ± 0.08 ± 0.06 ± 0.07
Total Phosphorus, 1.83 1.61 1.20 2.02 2.40 3.39 3.45 3.53 3.40 2.02 1.82 1.55
mg/l ± 0.09 ± 0.10 ± 0.08 ± 0.11 ± 0.13 ± 0.10 ± 0.09 ± 0.12 ± 0.14 ± 0.89 ± 0.13 ± 0.14
Total coliform, 73 118 135 463 112 345 988 739 553 476 165 179
MPN/ml ± 7 ± 10 ± 14 ± 38 ± 12 ± 31 ± 83 ± 65 ± 55 ± 45 ± 15 ± 18
Note. Here and in Table 2 : MPN - most probable number; "±" - standard deviation.
es (omnivore - OM, planktivore - PL, benthic feeder -BE, and carnivore - CA) in both of the rivers. First of all, the proportions of species in particular categories were compared between the two rivers. The proportion denotes the relative frequency of the fish using the particular trophic level among all the trophic levels available in that aquatic system [6].
For example, there are four species of planktivorous fish in the Churni River out of a total of 16 species; the estimate is obtained dividing 4 by 16 and multiplying the result by 100%. The proportion is thus 25%. Afterwards, the integer scores were assigned to each species according to their position within the food web (1 -OM, 2 - PL, 3 - BE, 4 - CA). The following equation was used to calculate the mean score (MS) for trophic level of the whole fish community:
N
MS = 1Y SS,
i = 1
where SSi (species score) - individual score for each species i; N - number of species recorded [14].
Habitat orientation was characterized in a similar way. Fish were classified into three general groups with respect to habitat orientation - pelagic (P), generalist
(G) and benthic (B) [8]. The percentage of species using the particular habitat among all the habits available in that aquatic system was estimated [6]. For example, there are six species of pelagic fish in the Churni River out of a total of 16 species; the estimate is obtained dividing 6 by 16 and multiplying the result by 100%. The proportion is thus 37.5%. The mean score for habitat orientation was calculated using the same equation as for the mean trophic level. The species score values were set as one for pelagic fishes, two for generalists, and three for benthic species [14].
Scores were assigned to each of the characteristics (i.e. trophic status and habitat orientatio
Для дальнейшего прочтения статьи необходимо приобрести полный текст. Статьи высылаются в формате PDF на указанную при оплате почту. Время доставки составляет менее 10 минут. Стоимость одной статьи — 150 рублей.