ХИМИЯ ВЫСОКИХ ЭНЕРГИЙ, 2013, том 47, № 5, с. 339-342
РАДИАЦИОННАЯ ХИМИЯ
УДК 541.15:541.515:543.422.27
THERMO-STIMULATED LUMINESCENCE ANALYSIS
OF POWDER OF THE GAMMA-IRRADIATED TETRAFLUOROETHYLENE/ETHYLENE COPOLYMER © 2013 г. V. G. Nikolskii1, S. R. Allayarov2, D. A. Dixon3
1Institute of Chemical Physics of the Russian Academy of Sciences, Moscow, Russia 119991
2Institute of Problems of Chemical Physics of the Russian Academy of Sciences, Chernogolovka, Moscow, Russia 142432 3Department of Chemistry, The University of Alabama, Tuscaloosa, AL 35487-0336
E-mail: sadush@icp.ac.ru Поступила в редакцию 21.12.2012 г. В окончательном виде 05.04.2013 г.
The thermo-stimulated luminescence of y-irradiated commercial copolymers of tetrafluoroethylene with ethylene were explored. There are five intense maxima in the luminescence curves. Position, half-width and number of maxima remain constant at doses of irradiation from 10 kGy up to 30 kGy. The first peak at 112 K to 119 K has the greatest intensity and is found on the luminescence curves of all of the investigated copolymers except for Tefzel®. For Tefzel®, the maximum occurs at 141 K. The differences of the glow curves in the different copolymers may be the result of impurities capable of reacting with ions or radicals formed under irradiation and by differences in the copolymer's topological structures.
DOI: 10.7868/S0023119713050086
The copolymer of ethylene with tetrafluoroethylene (CTE) has a number of excellent properties and is widely used in different areas [1—5]. One of the excellent properties of CTE is its high stability under gamma—irradiation [2, 3, 6]. Due to the poor solubility of fluorine containing (co)polymers, an investigation of changes in their phase behavior under irradiation conditions is difficult. For such cases, thermomechanical spectroscopy (TMS) [7] and thermo-stimulated luminescence (TSL) [8—10] are useful analytical tools. TMS yields a large number of copolymer molecular— topological parameters, such as the interchain behavior including the temperature of transformation, linear thermal expansion, free volume, and identity of topological blocks [11, 12]. The intensity of TSL glows can be increased as a result of a phase transformation due to increasing the molecular mobility, which can promote escape of active centers from traps. The intensity of the TSL changes in the temperature regions where the polymer undergoes structural transformations. Therefore, TSL can be used to determine the low temperature phase transitions ofpolymers [8—10]. In the present work the thermo-stimulated luminescence of y-irradiated CTEs is described.
EXPERIMENTAL APPROACH
Materials. The copolymers were from the Konstan-tinov Kirovo-Chepetsk Chemical Combine (Russia)
with brand names "Fluoroplast F-40", "Fluoroplast F-40LD", "Fluoroplast F-40P", "Fluoroplast F-40SH", and "Fluoroplast F-40E". Tefzel® was obtained from Du PontTM. The copolymers were not subjected to post purification.
Thermo-stimulated luminescence analysis. A standard thermoluminograph "TLG" was used to measure the TSL of the copolymers. The samples for TSL analysis have the form of a disk (diameter 10 mm, thickness 1.0 mm). Initial CTE powders were pressed at 573 K to form the films and were cooled to 293 K to anneal the pressed CTE melts at two speeds: "A" —2000 deg/min and "B" —2 deg/min. The samples with the form of a disk from the CTE films were placed on a cylindrical duraluminum pan and were pressed to its bottom using a metal cover with apertures to measure emitted light. At 293 K, the pan was pumped down to a pressure of 0.13 Pa to release any dissolved gases from the CTE. Samples were frozen down to 77 K and irradiated with y-rays from a 60Co source in a photo-isolated Dewar flask to stimulate the TSL. Before warming up in the TLG, the samples were stored at 77 K for 20 hours. Irradiation of the samples of CTE was performed in glass ampoules sealed in air with 60Co gamma-rays from a Gam-matok-100 source at an absorbed dose rate of 140 Gy/sec.
340
NIKOLSKII и др.
(а)
(b)
0.06
й
0.03
св
I II III
V
0.02 -
ч х4
1 \ 1 |
й
b.
св
0.01
0 -
200 400
T, K
(с)
I III IV V
200 400
T, K
600
I II
IV V
200 400
T, K
(d) I II III
600
0.010 -
й
£ 0.005 се / ч
ч
// х2 Ч ч
0 - JT / X _
1 80 | 160 T, K 1 240
0
0
0
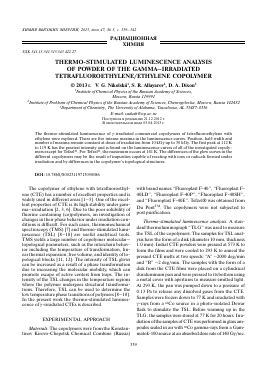
The glow curves of the copolymer of tetrafluoroethylene with ethylene of trademarked "F-40" (a), "F-40LD" (b), "F-40SH" (c) and "Tefzel" (d). The samples were gamma-irradiated at 77 K with a dose 20 kGy.
RESULTS AND DISCUSSION
During irradiation of the solid materials at low temperature, active ionic or radical centers can be formed [13]. These centers can be stabilized during irradiation and can participate in post-radiation processes. Heating of CTEs irradiated at 77 K can stimulate the mobility of stabilized active centers leading to their recombination. The glows on the TSL curves (Figure) are the result of light-emission during the recombination [8—10]. The glow curves of CTEs have several peaks both above and below 273 K. The intensity of the glows decreases with increasing temperature. The greatest intensity glow is found for the lowest temperature peak, which is observed in the temperature interval of 112 K to 119 K for all CTEs except for Tefzel®. Tefzel® has its greatest intensity at 141 K. The next two peaks are characteristic of all of the CTEs with maxima in the temperature intervals 155 K to 169 K and 194 K to 200 K. Other peaks are found at temperatures greater than 273 K but with lower intensity at temperatures 357 K to 365 K and 418 K to 419 K.
The values of the temperature of the separate maxima (Tmax) in the TSL glow curves of the CTEs are listed in Table and on the TSL curves of irradiated CTEs shown in Figure.
The differences of the glow curves in the different CTEs may be the result of impurities capable of reacting with ions or radicals formed under irradiation of the materials and by differences in their topological structures. The TSL glow curves of CTE can be changed as the dose of irradiation is varied. However, the number of maxima, their position, and their half-width remain constant at doses from 10 kGy up to 30 kGy in the glow curves of the CTEs, as in the case of irradiation of FEP [8]. The intensity of the TSL glows increases when passing through temperature intervals of molecular relaxation or mobility, which often occur at phase transitions. Therefore, some of the intense maxima of the TSL glow curves could be due to polymer glass transitions [9, 10, 14] or other phase transformations [8].
THERMO-STIMULATED LUMINESCENCE ANALYSIS OF POWDER 341
Values of the temperature of the separate maxima (Tmax) in TSL glow curves of the copolymers of TFE with ET (CTE)
CTE Trade mark Modea T K 1 max> ^
I II III IV V
F-40 А 116 155 ± 10 194 395
F-40 B 116 155 ± 10 194 395
F-40LD А 116 169 365
F-40LD B 116 (ATmax = 38) 418
F-40P А 116 160 ± 10 200 ± 10
F-40P B 116 (ATmax = 50) 200 ± 10 419
F-40SH A 112 195 ± 10 365 435 ± 5
F-40SH B 116 195 ± 10 418
F-40E A 116 155 200 ± 10 357 (ATmax = 50)
F-40E B 119 160 ± 10 200 ±10 336 419 (ATmax = 40)
Tefzel ® A 162 200
Tefzel ® B 141
maxima for all CTEs 112 to 119 155 to 169 194 to 200 357 to 365 418 to +419
a Samples "A" and "B" represent two ways to form the films from the CTE powders. They were cooled from 573 K to 293 K with speeds 2000 deg/min (A) and 2 deg/min (B). Both types of samples were frozen with identical speed 30 deg/min from 293 K to 77 K.
There is a relationship between the glass transition (Tg) and fusion (Tf) temperatures of high molecular compounds as given in equation (1) [15, 16].
Tg > 0.5 Tf. (1)
The use of the manufacturer's data [4] (Tg = 173 K, Tf = 523 K), the data determined by TMS for CTE in the form of granules (Tf = 535 K, Tg = 306 K [17]) or powders (Tf = 480 K, Tg = 289 K [12]) and the data determined by the TSL method (Table) show that the data determined by TMS are consistent with equation (1) with Tf ~ 0.57Tg and Tf ~ 0.6Tg, respectively, for granules and powders of CTE. Thus, the temperature at which the maxima of the TSL curves are found should not be attributed to the temperature of the glass transition or fusion of the CTEs. It is likely that the active centers stabilized during irradiation at 77 K and responsible for the TSL are highly reactive at higher temperature and are not present at room temperature.
The fact that the glow peaks for most CTEs are very similar at low temperature intervals suggests that the active centers formed on radiolysis are very similar. The separation of the glows into peaks at different temperatures is probably connected to the temperature dependence of the termination of stabilized active centers which have different kinetics.
CONCLUSION
The thermo-stimulated luminescence curves of investigated copolymers have five intense maxima in the
temperature ranges: 112 K to 119 K, 155 K to 169 K, 194 K to 200 K, 357 K to 365 K, and 418 K to 419 K. The lowest temperature peak has the greatest intensity for all CTE copolymers except for Tefzel®. For Tefzel®, the maximum moves to 141 K. During heating of the irradiated copolymers, a separation of radio-thermoluminescence glow into different peaks is probably connected to both the temperature dependence of termination of stabilized active centers and the physical heterogeneity of the CTEs, but not to phase transitions.
ACKNOWLEDGMENT
This research was partially supported by Found OCHNM - 8 of RAS. D.A. Dixon thanks the Robert Ramsay Fund at The University of Alabama for partial support.
REFERENCES
1. Kerbow D.L. // In Modern Fluoropolymers: High Performance Polymers for Diverse Applications, Sheirs J. (ed)., Wiley: New York, 1997, Chapt. 15.
2. Panshin J.A., Malkevich G., Dunaevskaja S. // Ftoro-plasti (Fluoroplastics). Khimiya: Leningrad, 1978.
3. WallL.A. // Fluoropolymers. Wiley-Interscienc
Для дальнейшего прочтения статьи необходимо приобрести полный текст. Статьи высылаются в формате PDF на указанную при оплате почту. Время доставки составляет менее 10 минут. Стоимость одной статьи — 150 рублей.