>K9T$, 2014, Tom 145, bmh. 3, CTp. 559 564
© 2014
ULTRAFAST FORMATION OF HYDRATED ELECTRONS IN WATER AT HIGH CONCENTRATION: EXPERIMENTAL EVIDENCE
OF THE FREE ELECTRON
P. Palianov"*, P. Martinb*,*F. Quéréb, S. Pommeret€
" Institute of High Current. Electronics, Siberin Branch. Russian Academy of Sciences
634055, Tomsk, Russia
bService des Photons, Atomes et Molécules "Service Interdisciplinaire sur les Systèmes Moléculaires et les Matériaux, UMR 3299 CNRS
Commissariat à l'Energie Atomique et aux Energies Alternatives, DSM/IRAMIS, CEA/Saclay,
91191 Gif sur Yvette, France
Received October 14, 2013
Using a time-resolved optical interferometric technique, we investigate the ultrafast primary events following the interaction of an ultrashort laser pulse with pure water in the TW/crrr regime. Because our method is sensitive to the quasi-instantaneous electron energy level position, we demonstrate that in contrast to the well-known low-intensity regime, where the free electrons are instantaneously captured by pre-existing traps, in this new regime of excitation, free electrons are clearly observed, exhibiting a substantial contribution in the near IR. The delayed localization is attributed to the saturation of pre-existing cavities in the liquid by the large number of the excited electron states created.
DOI: 10.7868/S0044451014030185
The solvatod electron appears in a variety of polar liquids and is created as soon as an electron is injected into the solvent. This chemical species has been thoroughly studied experimentally and theoretically fl 4] because it is recognized to take part in a very large class of aqueous chemical reactions. The solvatod electron has boon particularly studied in water because of its key role in biology, chemistry, and physics. It can be generated by several different mechanisms, e. g., radiol-ysis, electrochemical, or optical excitation. The equilibrated solvatod electrons, whose ground state survives for some hundreds of nanoseconds [5], resides in an ap-proximatively spherical solvent cavity made with six water molecules with one of their OH bond pointing toward the cavity center [6, 7], as was recently confirmed by Car Parinello molecular dynamics studies [8, 9]. Its spectral properties, first reported in the early 1960s, exhibit a broad asymmetric absorption band centred at 1.75 oV [10], which has boon intensively studied since
E-mail: palianov'&yandex.ru E-mail: philippe.martin'&cea.fr
its discovery [11]. The ground state of this spherical trap has an s-liko character and a set of three nearly degenerate />like excited states [6, 7,12] correspond to its first excited state.
To gain a bettor understanding of the nature of the electron water interactions, two types of experiment have mainly boon realized up to now: i) time-resolving the transient absorption in pure liquid water from the injection of electrons in the conduction band up to the full solvation [13 15] and ii) measuring the absorption on the equilibrated solvatod electron [16, 17]. We note that all these experiments have boon done using the same ultrafast time-resolved visible infrared absorption spectroscopy techniques at "low" pump power densities (a few GW/'em2). The infrared absorption spectrum [18] and the Raman spectrum [19] of the hydrated electron have boon measured, which is in favor of the first-principle molecular dynamics [8, 9].
In this paper, we clarify the very early stages of the formation of the solvatod electron by using another technique allowing a direct and simultaneous measurement of the variation of the real and the imaginary part (absorption) of the refractive index with a tem-
poral resolution bettor than 50 fs. The main advantage of this interferonietric-based techniques, is that it permits following the instantaneous position of the energy level of the electron in real time [20]. Contrary to most of the previous studies, the present one has been performed at very high pump power, producing an extremely high concentration of hydrated electrons (up to the molar regime) [21,22]. In a sense, what we mimic is closer to what occurs in dense tracks of radiation chemistry [1]. The experimental setup has already been described in detail [20, 23] and we only briefly recall the principle of the measurements. The probe system consists of two identical pulses separated by a fixed time delay and collinoarly propagating. One (the reference pulse) crosses the sample before the pump pulse and the other (the probe pulse) after it. The reference and probe pulses are sent into a spectrometer, and the perturbed region in the sample is imaged at the entrance slit.
The modification of the refractive index An induces a phase shift A'l> for the probe pulse, which is proportional to the length L over which the pump and probe beams overlap. The phase shift is given by
9 _ r
A$(f) = ^Ro(An(f)), A
where A is the probe beam wavelength and An(t) = = n(t) — no is the instantaneous change of the refractive index that results from the pump-induced excitation (n0 is the unperturbed refractive index). By using the contrast of the fringes, we obtain the change in the absorption coefficient, i.e., in the imaginary part of the refractive index. This can be written explicitly as
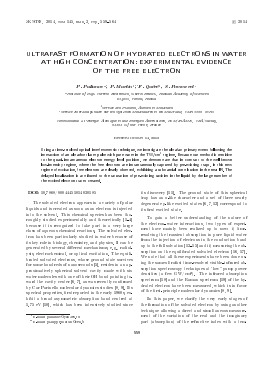
Pump 800 nm
-<-Probe
395 nm
.4=1— exp
2Lu>
Im (n(t))
Both quantities (the phase shift and absorption) are obtained by a Fourier analysis of the interference image at the output of the spectrometer. The laser with the titanium-doped sapphire (Ti-Sa) deliver 60-fs pulses with energies up to 100 mJ. We use a part of the laser beam with fundamental wavelength (800 11111, 1.55 oV photons) as a probe and the pump beam after the frequency doubling (395 11111) is spatially filtered, to produce a soft Gaussian profile. Typically, we used pulse energies in the 0.4 mJ range accommodating shot-to-shot fluctuations of about 10%.
The pump and probe arrangement is shown in Fig. 1. The water being contained in a quartz cell, the main difficulty was to avoid some possible spurious contributions from the cell itself. Of course, it has been checked that without water in the cell, no fringe
Reference probe 395 nm
To spectrometer
Fig. 1. Schematic view of the pump and probe arrangement. The intensity in the middle of the cell is 4-1012 W/crn2, the intensity at the surface of the cell
is l(f W/cm-
distortion was visible on the CCD camera. We used a very short focal lens (10 cm) adjusting the focal point in the center of the cell, where the intensity was close to 4 • 1012 W/'cni2, whereas the intensity at the surface of the cell was lower than 10* W/'cni2. This intensity in water was set slightly bellow the filament at ion or white light generation regime. In practice, the window where the signal is unambiguously distinguishable from the quartz cell and below the breakdown of water was very thin, impeding experiments of varying the pump intensity over large ranges.
The temporal behavior of the phase shift A'l> and the corresponding absorption ln(/o///.), where Io(I/.) is the intensity of the probe beam passing through unperturbed (perturbed) water, are shown, after a spatial integration along the slit of the spectrometer, in Fig. 2. We present all shots without discrimination or averaging. The relative spreading of the data points corresponds to exact error bars. This spreading occurs, because several shots at higher intensities due to shot-to-shot energy fluctuations, induce the breakdown of water, producing spurious phase shifts in the interference pattern. In these graphs, the zero delay cor-
AO, rad 0.4
0.2
0
-0.2
Mm) 1.2
0.8 0.4
Fig. 2. (a) Phase shift and (b) absorption of the probe pulse as functions of delay time in pure water. The incident pulse intensity is 2.2 TW/cm2 and the probe pulse wavelength is 1.57 eV. Circles correspond to the single-shot experiment; full thick lines to the simulation based on the Drude-Lorentz model; dashed lines to the free-electron contribution; dash-and-dot-lines
to the trapped electron contribution
responds to the maximum overlap between the probe and the pump envelop pulses. In Fig. 2a, we first observe a positive phase shift (for negative delay times), immediately followed by a negative one (for small positive delay times). After roughly 400 fs, the phase shift becomes positive and slowly increases to a steady-state value within the time window under consideration. The behavior of absorption (Fig. 2b) is less complicated: we first observe a very abrupt increase right after the pump pulse, followed by a relaxation on the same time scale as the increase in the phase observed in Fig. 2 a. We note that the maximum absorption is reached approximately 400 fs after the pump pulse. A similiar behavior was already observed for the transient absorption at high pump power densities with a pump wavelength of 400 nm [22] or 266 nm [21].
To interpret our results, we use the Drude-Lorentz model. This is basicaly a two-level system in which, in order to preserve the "band structure" and retain the validity of the model, the condition is imposed that the number of excited electrons be small compared to the total number of electrons available in the liquid (3.3 • 1022 cm-3). As we see in what follows, this requirement is perfectly satisfied. The Drude-Lorentz model can be written as
A n(t) = n2Ip(t) +
e2 -Nfree(t)
p 2no£o (cjJ2 — icj/Tfree)m*
NtraP(t)
+
(utrapi*) - - iuWsolv/h)m(
+
(1)
where e is the electron charge, me is its mass, m* its reduced mass in the conduction band, So is the vacuum permittivity, \/r^ree is the collision rate of the excited free electrons, Wsolv is the width of the optical absorption spectra of solvated electrons, no is the refractive index, U2 is the nonlinear refractive index, 0Jtrap(t) is the absorption frequency of the trapped electron, N^ree(t) is the number of free electrons, and Ntrap is the number of trapped electrons.
The first term in Eq. (1) represents the Kerr effec
Для дальнейшего прочтения статьи необходимо приобрести полный текст. Статьи высылаются в формате PDF на указанную при оплате почту. Время доставки составляет менее 10 минут. Стоимость одной статьи — 150 рублей.