ОПТИКА И СПЕКТРОСКОПИЯ, 2015, том 118, № 4, с. 693-697
ГЕОМЕТРИЧЕСКАЯ И ПРИКЛАДНАЯ ОПТИКА
y%K 535.37.004.14
A NOVEL QUANTITATIVE ANALYSIS METHOD OF THREE-DIMENSIONAL FLUORESCENCE SPECTRA FOR VEGETABLE OILS CONTENTS
IN EDIBLE BLEND OIL © 2015 n Jing Xu*, Yu-Tian Wang*, and Xiao-Fei Liu**
* Measurement Technology and Instrumentation Key Lab of Hebei Province, Yanshan University,
Qinhuangdao, Hebei 066004, China ** Hebei Provincial Key Laboratory of Parallel Robot and Mechatronic System,Yanshan University,
Qinhuangdao, Hebei 066004,China E-mail: ysuxujing@163.com Received March 15, 2014
Edible blend oil is a mixture of vegetable oils. Eligible blend oil can meet the daily need of two essential fatty acids for human to achieve the balanced nutrition. Each vegetable oil has its different composition, so vegetable oils contents in edible blend oil determine nutritional components in blend oil. A high-precision quantitative analysis method to detect the vegetable oils contents in blend oil is necessary to ensure balanced nutrition for human being. Three-dimensional fluorescence technique is high selectivity, high sensitivity, and high-efficiency. Efficiency extraction and full use of information in three-dimensional fluorescence spectra will improve the accuracy of the measurement. A novel quantitative analysis is proposed based on Quasi-Monte-Carlo integral to improve the measurement sensitivity and reduce the random noise. Partial least squares method is used to solve nonlinear equations to avoid the effect of multicollinearity. The recovery rates of blend oil mixed by peanut oil, soybean oil and sunflower are calculated to verify the accuracy of the method. It is increased, compared the linear method used commonly for component concentration measurement.
DOI: 10.7868/S003040341504008X
INTRODUCTION
Edible blend oil is a good choice to keep balanced nutrition. An important index to evaluate its nutrition is the determination of vegetable oils contents in it. Vegetable oil has fluorescent substances, such as: fat hydrocarbon, vitamin, etc. Different vegetable oil has different contents of fluorescent substances, so it is a feasible way to identification and quantitation of different kinds of vegetable oils for balanced nutrition, but different fluorescence spectra of vegetable oils have a lot of similarities, so the detection of blend oil is difficult. The kinds of vegetable oils are indicated on the ingredients list, so according to the materials provided by the manufacturer, the detection of blend oil for balanced nutrition is only quantitative analysis. Due to low fluorescence quantum yield, fluorescence intensity of three-dimensional fluorescence spectra (3DFS) is low, so measurement sensitivity of conventional processing methods is not good. It is necessary to improve measurement sensitivity for better measurement accuracy.
Fluorescence spectroscopy is used to characterize and differentiate vegetable oils [1]. It is also used for classification of Sherry vinegars [2]. Fluorescence spectroscopic is proving to be a good choice [3, 4]. Fluorescence spectroscopy and multivariate methods
are used for the determination of brandy adulteration with mixed wine spirit [5]. Liquid chromatography and fluorescence detection are used for selective identification and quantification of saccharin [6].
THEORY AND CALCULATION
According to the Lambert-Beer law and Taylor series, the relationship of fluorescence intensity and concentration is linear when scl < 0.05:
If = 2.3KI 0ecl = K ' c, (1)
where If is fluorescence intensity. K is proportional coefficient about spectrometer. I0 is the intensity of incident light. s is molar absorption coefficient. c is solution concentration. l is optical path length from the incidence to the exit.
Quasi-Monte-Carlo integral takes the sum of function value on the points generated evenly in the space Dm
In = %S*-...> *i}>
N
i=1
as integral approximation
I = J Dm J g *2' ...' Xm )dxid*2 ... dxm'
N
(2)
(3)
694
XU et al.
where SD is the volume of Dm.
The steps of the novel quantitative analysis method of three-dimensional fluorescence spectra for vegetable oils contents in edible blend oil are described below.
Step 1. Measure 3DFS of each vegetable oils in blend oil. Find out each representative integral area SD with strong fluorescence intensity or different from the rest of components. Using Halton sequence generate points of uniform distribution in each area. Calculate the sum needed blew of the different power of fluorescence intensity at points in each area, multiplied by the area and divided by the number of the points and the concentration of the vegetable oil.
Step 2. Calculate the sum of third power of the fluorescence intensity of the blend oil at the same points generated in step 1 in each area, multiplied by the area of area and divided by the number of the points:
J(k) = SD
f" N
N
£ (// (x(0, y (i)))3,
(4)
i=1
where I is 3rd power integral approximation of mixture fluorescence intensity on kth area. If (xw, yw) is the fluorescence intensity of ith point in each area.
Step 3. Due to additivity of fluorescence,
Io = Ii + I2 + ••• + Im, (5)
and integral linear additivity, nonlinear equation of concentration are listed as
I (k) = JJ I&xdy = jj (Ii + 12 + ... + Im fdxdy =
m m-1 m
= £ jj Ildxdy + 3££ jj IfIjdxdy +
+
i=1 i=1 j=i +1 m-1 m
+ 3£ £ ii IiI2dxdy
i=1 j=i+1
m-2 m-1 m
+ 6£££ ii IiljIkdxdy =
i=1 j=i+1 k=i+1
m-1 m
(6)
= £c<3ii (K')3dxdy + 3£ £ c2cjii(K')2Kjdxdy
i=1 i=1 j=i+1 m-1 m
+ 3£ £ cc2ii Ki(Kj)2dxdy +
i=1 j=i+1 m-2 m-1 m
+ 6£ £ £ CCjCk ii K\KjK'kdxdy.
+
i=1 j=i+1 k=i+1
Step 4. The solutions of simultaneous equation in each area solved by partial least squares are the concentrations of each vegetable oil in the blend oil. Due to partial least squares, the effects of multicollinearity are avoided and the calculation precision is improved. To improve the calculation precision more, more characteristic area should be chosen when one vegetable oil has more than one obviously characteristic area different from the rest oils.
EXPERIMENTAL
Each vegetable oil in blend oil is written on ingredients list, so the blend oil detection is equivalent to quantitative determination of vegetable oils in blend oil in the condition that the kinds of vegetable oils are known. Peanut oil, soybean oil and sunflower oil are mixed in different concentration ratios to simulate different nutritional edible blend oil. Single oil is regarded a whole, not considered the components in each vegetable oil. Content determination of vegetable oils in blend oil using the method proposed here to verify the effectiveness of the method.
Sample Preparation. Pure peanut oil, soybean oil and sunflower oil, four 5 ml cuvettes; three 1" ml syringes; several test tubes and beakers. Three kinds of vegetable oils are extracted respectively by three syringes mixed in different concentration ratios (mix proportions are shown in Table 1). Shake well in test tubes, then put them in cuvettes for fluorescence experiments.
Equipment. FS92" fluorescence spectrometer produced by Edinburgh Company is used for fluorescence detection. SNR is 6""" : 1. Excitation and emission monochromators are M3"" monochromators. Distinguish ability is "."5—18 nm.
In the experiment, excitation wavelength range is 25"—4"" nm. Emission wavelength range is 26"—75" nm. Slit width is 1.67 nm. Excitation step length is 5 nm. Emission step length is 2 nm. Scanning integration time is ".1 s. The temperature of the test environment is 2"°C.
RESULTS AND DISCUSSION
Three-dimensional and contour fluorescence spectra of sunflower oil, soybean oil and peanut oil are shown in Figs. 1, 2, and 3.
Figure 1 shows the strong intensity excitation wavelength range of sunflower oil is 370—380 nm. The strong intensity emission wavelength range is 420—470 nm. There are two apparent fluorescence peaks. A good choice of characteristic areas (excitation wavelength range/emission wavelength range) is 365-375/435445 nm and 375-385/465-475 nm. Figure 2 shows the strong intensity excitation wavelength range of soybean oil is 350-370 nm. The strong intensity emission wavelength range is 430-450 nm. There is one apparent flu-
OnTHKA H CnEKTPOCKOnra tom 118 № 4 2"15
Table 1. Prediction concentration and recovery rate of each vegetable oil in blend oil
Actual concentration, ml Prediction concentration, ml Recovery rate, %
Sample Sunflower Peanut Soybean Sunflower Peanut Soybean Sunflower Peanut Soybean
oil oil oil oil oil oil oil oil oil
1 0.5 3.0 1.5 0.507 2.96 1.52 101.4 98.7 101.3
2 0.8 2.5 1.7 0.82 2.47 1.71 102.5 98.8 100.6
3 1.0 2.0 2.0 1.01 1.98 1.97 101 99 98.5
4 1.3 1.8 1.9 1.28 1.77 1.95 98.5 98.3 102.6
5 1.5 1.3 2.2 1.48 1.32 2.17 98.7 101.5 98.6
6 1.8 2.2 1.0 1.78 2.16 1.02 98.9 98.2 102
7 2.0 0.5 2.5 2.02 0.51 2.48 101 102 99.2
8 2.3 2.2 0.5 2.27 2.24 0.51 98.7 101.8 102
orescence peak. Figure 3 shows three apparent fluorescence peaks of peanut oil. A good choice of charac ter-istic areas (excitation wavelength range/emission
wavelength range) is 355-365/390-400 nm, 365— 375/430-440 nm and 370—380/460—470 nm. After comprehensive consideration of characteristic areas of
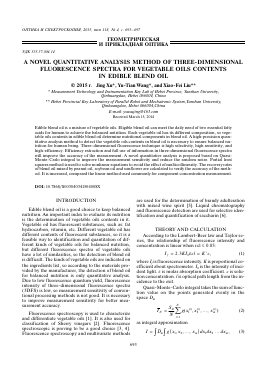
Fig. 1. 3-dimensional fluorescence spectra (a) and fluorescence contour spectrum (b) of sunflower oil.
Fig. 2. 3-dimensional fluorescence spectra (a) and fluorescence contour spectrum (b) of soybean oil. ОПТИКА И СПЕКТРОСКОПИЯ том 118 № 4 2015
696
XU et al.
Excitation wavelength, nm
Emission wavelength, nm
Fig. 3. 3-dimensional fluorescence spectra (a) and fluorescence contour spectrum (b) of peanut oil.
each vegetable oil, five characteristic areas are selected ultimately. Excitation wavelength ranges/emission wavelength ranges of characteristic areas are 350 ~ ~ 353/430 ~ 433 nm, 355 ~ 358/395 ~ 398 nm, 361 ~ ~ 364/391 ~ 394 nm, 367 ~ 370/437 ~ 440 nm, 377 ~ ~ 380/467 ~ 470 nm. 5000 points are generated in each
Для дальнейшего прочтения статьи необходимо приобрести полный текст. Статьи высылаются в формате PDF на указанную при оплате почту. Время доставки составляет менее 10 минут. Стоимость одной статьи — 150 рублей.