ОРИГИНАЛЬНЫЕ СТАТЬИ
y%K 543
APPLICATION OF DIFFERENTIAL SPECTRA FROM TWO DIFFERENT ENVIRONMENTS IN SIMULTANEOUS QUANTIFICATION OF NEW FUCHSINE, CRYSTAL VIOLET AND MALACHITE GREEN IN THE PRESENCE OF UNMODELED INTERFERENTS USING FIRST ORDER MULTIVARIATE CALIBRATION METHOD
© 2015 Tahereh Heidari1, Fatemeh Ghasemi-Moghaddam, Mahmood Chamsaz
Department of Chemistry, Faculty of Science, Ferdowsi University of Mashhad Azadi Square, Mashhad, Iran 1E-mail: taherehheidari@um.ac.ir Received 22.11.2012; in final form 12.09.2013
This paper proposes the possibility of applying first order calibration methods to unknown sample(s) with un-modeled component(s) using the differential spectra obtained from subtracting of the absorbance spectra of sample that are recorded in two different environments. The main interest is that the method can be performed to quantify systems if the spectra of their unmodeled component(s) are the same in two different phases using first order calibration methods. The procedure demonstrates simultaneous determination of new fuchsine, crystal violet and malachite green in the presence of sunset yellow, tartarazine and amaranth as unmodeled interferences, whose spectra differ in aqueous and nonionic micellar solution of Triton X-100. The obtained satisfactory results indicate the successful applicability of the proposed method to complex samples.
Keywords: differential spectra, unmodeled interferences, PLS, triphenylmethane dyes.
DOI: 10.7868/S0044450215010211
Triphenylmethane (TPM) dyes are an important class of commercial dyes that have potential applications in the textile industry as sensitizers for photoconductivity and in medicine as antibacterial and sterilization agents during blood transfusions [1—6]. Among the TPM dyes, crystal violet (CV) and malachite green (MG) have been widely used together, as other TPM dyes such as new fuchsine (NF) [7, 8].
TPM dyes are often found in wastewaters; some of them have been found to be carcinogenic, genotoxic [7, 9, 10] and tumor promoting [11-13]. About 20% of the dyestuffs produced in the world are discharged into streams without any pretreatment [14]. Thus, many countries have banned the use of MG and CV in aquaculture [15]. However, due to their low cost and high effectiveness, these harmful dyes are still used and will probably continue to be used in the aquiculture in some parts of the world. Several methods have been proposed for their determination such as liquid chromatog-raphy-tandem mass spectrometry [16], liquid chroma-tography-visible spectrophotometry [17], capillary electrophoresis—Raman spectroscopy [18] and magnetic solid phase extraction—spectrometry [19]. These methods developed in literature often require complicated pretreatment procedures; thus, alternative methods with simple pretreatment seem to be crucial
for the determination of dyes when they coexist with some interferents. First-order calibration methods such as multiple linear regression, principal component regression, and partial least-squares regression (PLS) deal with a vector of variables per sample (e.g., an FT—IR spectrum). These allow the simultaneous quantification of multiple analytes without the need for selectivity in the measured variables for the ana-lytes. The use of these methods provide the so called first-order advantage, the possibility to quantify an an-alyte in the presence of interferents [20] as long as the interferent compounds present in the calibration samples during the establishment of the calibration model. A drawback of these methods is that all possible interferents in the samples should be qualitatively known in order to be included in the calibration model, which normally leads to the need for a large number of calibration samples. Therefore, developing methods that can eliminate this limitation without the need for repeating calibration stages or referring to second order calibration methods is important. Besides, extensive researches have recently confirmed the ability of surfactants to affect the electronic absorption spectra of solutions of many dyes, viz., triphenylmethane [21, 22]. Surfactants usually affect spectral parameters: the intensity in the absorption bands can be increased or
decreased and the absorption maxima of reagents shifted [23—26]. These phenomena depend on type of solutes, pH and surfactants.
The paper illustrates that if the spectra of analytes differ in aqueous and micellar environment while the spectral shapes of interferent(s) are the same in both phases, the differential spectra can eliminate the troublesome unmodeled interferent(s) in the unknown
Cl
(a)
\ © Cl9 N—
N ^^_
N
(c)
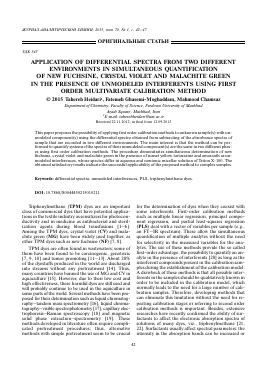
samples. The use of the differential spectra instead of direct spectral data in first order calibration analysis can be applied for determination of analyte(s) in unknown samples with unmodeled interferent(s). The method was evaluated for simultaneous quantification of NF, CV and MG in the presence of sunset yellow, tartarazine and amaranth as unmodeled interferents in unknown samples. Chemical structures of dyes were shown in Scheme.
NH2
h2n
HCl
NH
O3S
HO
SO-(d)
HO
/ V_ ^SO- -O3S
O3S—\ y-N=N \
OH
(e) (f) SO3
Structural formula of dyes: MG (a), CV (b), NF (c), amaranth (d), tartarazine (e) and sunset yellow (f).
THEORETICAL BACKGROUND
In this work, it will be assumed that the spectral shapes and molar absorption coefficients of analytes are different in aqueous and micellar environments, but the spectral shapes of interferents are independent in two environments. At first, let us assume that there are two calibration samples and their spectra are measured in aqueous (saw1, .saw2) and micellar environments
C^aml, ^am2):
Saw1 Saw Sam2 SamCa2,
(1) (2) (3)
Saw2 SawCa2 •
(4)
Here saw and sam are vectors of molar absorption coefficients in N wavelengths from analyte in aqueous and micellar environments, respectively; ca1 and ca2 are the concentrations of analytes in two calibration samples; saw1 and saw2 are vectors of analyte's spectra in N wavelengths in two calibration samples in aqueous environment, sam1 and sam2 are analyte's spectra in two calibration samples in micellar environment. Differential spectra are obtained from the difference between measured spectra in two environments in each sample, sad:
sad1 sam1 saw1 ^al(sam saw), (5)
sad2 — s<
am2
saw2 ca2(sam saw).
(6)
Then
sadl/sad2 = cal/ ca2.
(7)
Based on Eq. (7), it is clear that the differential spectrum of analyte is directly proportional to its concentration. It can be expressed by a typical unknown sample including one analyte "a" and an interferent component "i" whose spectra of the samples are recorded in both environments. If there is no interaction between components and they follow Beer's law, it can be written:
sw sawcax + siwcix, (8)
sm samCax + simcix. (9)
Here siw and sim are the pure spectra of interferent components in aqueous and micellar environments, cax and cix state the concentration of analyte and interferent component and sw and sm are their spectra. Provided that the spectra of interferent component in aqueous and micellar environments are the same, thus:
Siw = Sim. (10)
Hence, subtracting the spectra in two different environments deletes the interferent component share:
sd sm sw cax(sam saw), (11)
where sd denotes differential spectrum in two different environments; this differential spectrum is defined as a function of the concentration of analyte.
EXPERIMENTAL
Instrumentation. Absorption spectra in the range of350—700 nm were recorded on an Agilent 8453 pho-todiode-array spectrophotometer with spectral resolution of 1 nm and 1 cm path length quartz spectrophotometer cells. The measurements of pH values of solutions was performed on a Metrohm 620 pH-meter. All experiments were carried out at room temperature (25 ± 1°C). The ParLes package38 for implementation of PLS regression algorithm was used. The mathematical program MATLAB 7.6 (R2088a) (Math Works, Cochituate Place, MA) was used for data processing.
Reagents. All chemicals were of analytical-reagent grade. Sodium hydroxide, potassium chloride, MG, CV, NF, sunset yellow, tartarazine and amaranth were commercially obtained from Merck and used without further purification. All solutions were prepared with doubly distilled water. The Stock solutions of 100 mg/L of NF, CV, MG and 1000 mg/L of sunset yellow, tartarazine and amaranth were prepared by 0.1 M acetic acetate buffer at pH 4.00 as solvent and were stored in plastic amber bottles at 5°C protected from light. Working solutions were prepared by appropriate dilution of the stock solutions. Acetic acetate buffer was prepared at pH 4.00 by 1 M NaOH to 1 M acetic acid. A 2.5 M solution of potassium chloride was prepared
by dissolving its crystals in doubly distilled water. The nonionic surfactant Triton X-100 (TX-100) was a product ofAldrich. The stock solution of 4% (v/v) surfactant was prepared by dissolving 4.00 mL of TX-100 in 10.00 mL doubly distilled water.
Procedure. A calibration set having twenty five calibration samples prepared by mixture of the three an-alytes according to a 5-level Taguchi orthogonal array design with concentrations distributed in the ranges of (mg/L) 1-3 for CV, 1-3 for MG and 1-5 for NF. In addition, twenty prediction mixture samples including the interested analytes and interferents in the ranges of (mg/L) 2-14 for sunset yellow, 11-50 for tartarazine and 3-19 for amaranth. For fixing ionic strength, it was necessary that all solutions in the experiment be performed in 0.125 M potassium chloride and have the same concentration of pH 4.00 acetic acetate buffer solution (0.1 M). A spectrophotometer was used due to easy method, low-priced analyses and significant savings in time and chemicals in the comparison with HPLC. The absorbance spectrum of 2.0 mL of sample, calibration or prediction sample, in quartz cell was recorded by measuring absorbance against a blank so
Для дальнейшего прочтения статьи необходимо приобрести полный текст. Статьи высылаются в формате PDF на указанную при оплате почту. Время доставки составляет менее 10 минут. Стоимость одной статьи — 150 рублей.