Лёд и Снег • 2012 • № 3 (119)
УДК 504.47
Changing of the Altai glacier system since the mid-twentieth century and its response to the climate warming in future
© 2012 г. V.M. Kotlyakov1, Xie Zi-chu2' 3, Wang Shu-hong2, Wang Xin3 4, T.Y. Khromova1, G.A. Nosenko1
1Institute of Geography Russian Academy of Sciences, Moscow;
2College of Resources and Environment Science, Hunan Normal University, Changsha Hunan 410081, China;
3Cold and Arid Regions Environmental and Engineering Research Institute Chinese Academy of Sciences, Lanzhou Gansu 730000, China;
4Department of Geography, Hunan University of Science & Technology, Xiangtan, 411201, China
direct@igras.geonet.ru
Статья принята к печати 18 марта 2012 г.
Алтай, изменение климата, каталог ледников, ледниковые системы.
Altai, glacier system, glacier inventory, climate change.
Characteristics of the Altai glacier system are analyzed on the data from Chinese and Former Soviet Union glacier inventories. Two glacier data sets, recent remote sensing data and the glacier inventories data were compared. It has been found that 208 glaciers disappeared and the glacial area decreased by 12%. Functional models of the glacier system variations have been developed using the equation of relationship between an annual glacier ablation and a mean summer temperature; the glacier system structure and behavior of the equilibrium line altitudes at the steady state were taken into account as well. The models were used to study response of the glacial runoff to a climatic change. The model results show that, under the climate warming scenario of 0.05 T/year, only 3% Altai glaciers in China and 9% in Russia will remain by the end of this century.
Introduction
The Altai mountain system is located in the centre of Euroasia at boundaries of China, Kazakhstan, Russia and Mongolia. It extends from east to west for longer than 2000 km. As a whole, the Altai consists of a series of individual mountains, and its highest peak, Belukha, with altitude of about 4506 m, is located at the intersection of Russian and Kazakhstan boundaries. Owing to its relatively high elevation the Altai is a large glacierized region in middle latitudes [1, 5, 14].
A glacier system is understood as a system consisting of certain number of individual glaciers, located in the same region and, thus, influenced by similar climate conditions, so they should be organized according to similar interior laws. It can be divided and sub-divided according to their certain physical characteristics, mountain ranges, watershed boundaries etc. [13]. As it follows from the glacier inventories in Russian [2, 3], the total area of the Altai glaciers located on the territory of Former Soviet Union is 910 km2, and the total glacial area of the Mongolian Altai (including China and Outer Mongolia of nowadays) is 840 km2. Therefore, the total glacial area in the Altai is 1750 km2 with their volume of about 84 km3. In this paper, the Altai glaciers are considered as the large glacier system sub-divided into the Russian Altai glacier system, its total area of 880 km2, in the North and the Chinese Altai glacier system, its total area of 280 km2, in the South. Structures, change of characteristics of the Altai glacier system are analyzed, and its future changes due to the climate warning are predicted by means of the above functional model.
Structural characteristics of the glacier system
Quantitative structure of the glacier system. The glacier inventories of Russia [2, 3] and China [11] were reassembled in the view of the glacier system. Volume of ice was calculated by the empirical formula deduced from relationship between different types of glacier volumes and average thicknesses [6]. The statistical result shows that the Altai glacier system consists of 1441 glaciers with area of about 1160 km2 and volume of about 59 km3 (Table 1).
Dimensional structure of the glacier system. Dimensional structure of the glacier system was determined according to the size rate standard of the World Glacier Monitoring Service based on the reassembled glacier database of a region under consideration. We organized the glaciers from the smallest size to the largest one in area, number and volume with respect to a glacier system and then calculated its cumulative percentage. When the cumulative percentage reached 50%, the glacier sizes in the glacier system were defined as medium size in area (Smed(S)), number (Smed(N)) and volume (Smed(V)), respectively. The medium sizes of the Altai glacier system are presented in Table 2 and Fig. 1. The median sizes of Smed(N), Smed(S), Smed(V) are 0,3; 2 and 3, 4, respectively. They are relatively smaller than those in southern Tibet and the river Tarim Basin [20, 22]. The median sizes of glacier system of the rivers Katun and Biya headstream were the largest ones. Since the median size in area (Smed(S)) is more informative than the average value of
Table 1. Quantitative characteristics of the Altai glaciers in different watersheds*
Watershed N S V L 5 D
number % area, km2 % volume, km3 % km km2 m
Irtysh 201 13.95 102.20 Russian Al 8.81 tay 5.6026 9.47 1.2 0.51 55
Katun 777 53.92 742.40 64.03 37.927 64.10 1.3 0.96 51
Biya 24 1.67 8.10 0.70 0.323 0.55 0.7 0.34 40
Others 36 2.50 27.80 2.40 1.307 2.21 1.2 0.77 47
Total 1 039 72.03 880.50 75.94 45.1596 76.32 1.0 0.85 52
Irtysh 390 27.06 275.12 Chinese Al 23.73 tay 13.8376 23.39 1.1 0.71 50
Inner basin 13 0.90 3.91 0.34 0.174 0.29 0.8 0.30 45
Total 402 27.97 278.98 24.06 14.0116 23.68 1.0 0.69 57
All studied area Total 1 441 100.00 1159.53 100.00 59.1712 100.00 1.2 0.80 49
*N is quantity of the glaciers, S is the glacier area. Vis the glacier volume; L is the mean length of glaciers; S is the mean area of glaciers; D is the mean thickness of glaciers.
100-
^ 80-
<D O)
то 60-
Ф
о
Ш
40-
20-
Smed(N) / S„,JS)/ У? У/ // / / / / / / / / / /
/ ✓ / Smed(V)
/ / /
/ / / / /
- / / у/ /
-1. r ,-T^ 1 '— / l.l.l 1 1 1. 1
Table 2. The median size of glaciers in river basins of Altai
Area rate, km2
Fig. 1. Cumulative percentage curve of number (N), area (S), and volume (V) of the glacier system versus different glacier size rates in Altai
Рис. 1. Кумулятивные кривые процентного соотношения количества (N), площади (S) и объёма (V) ледников разных размеров в ледниковой системе Алтая
glacier area (S) [10], the Smed(S) was used as a calculating parameter to run the functional model of the glacier
system response to climate warning instead of mean area
value of glacier system.
Altitude structure of the glacier system. Two approaches were applied to obtain the altitude structure characteristics of the glacier system. One was direct averaging of the characteristic elevations of individual glaciers in a glacier system, such as a median, highest and lowest elevation, etc. The other approach was interpreting of information about distribution of glacier area against the glacier elevation in a glacier system. Empirical formula was developed to calculate distribution of glacier area
Watershed Smed(N) Smed(V) S
Buhtama Irtysh Rus 0.2 sian 1.4 2.9 0.6
Kenjelik 0.5 0.9 0.8 0.74
Headstream of Irtysh 0.2 0.5 0.7 0.39
Kurjum 0.1 0.2 0.2 0.19
Uba 0.2 0.2 0.2 0.16
Haba Irtysh Ch 0.2 iina 0.93 1.42 0.53
Burgin 0.25 2.28 2.66 0.82
Harertysh 0.11 0.12 0.12 0.11
Source of Irtysh 0.12 0.23 0.25 0.18
Total Irtysh Ka 0.21 tun 1.71 4.4 0.66
Argut 0.3 1.69 2.6 0.84
Kapjai 0.6 1.1 1.1 0.79
Sobehie 0.3 1 1 0.13
Kuragana 0.3 0.8 0.8 0.46
Headstream of Katun 0.8 4.1 4.1 2.5
Biya 0.6 4.3 4.8 1.49
Total 0.35 2.1 3 0.96
Other watershed 0.6 1.8 1.9 1.08
The entire Altai: Total 0.3 2 3.4 0.8
against the elevation [4], and it was successively applied for glacier systems of Tien Shan [15], Southern Tibet [21], Tarim River Basin [19]. This formula is also workable for the Altai glacier system. The altitude struc-
Table 3. Characteristics of the glacier altitude structure in Altai, m*
Watershed H ^max s H 11med H 11 mes TJ 11 med TJ n max TJ n min AH
Irtysh 3000 3150 3122 2979 3191 2767 424
Katun 3099 3150 3129 3053 3332 2774 558
Other watersheds 3203 3350 3281 3179 3360 2998 362
Whole investigated area 3101 3150 3172 3027 3278 2776 502
*Hmax Hmed and Hmes are the maximum elevation, median elevation and elevations weighted by area obtained from calculated distribution of glacier area with elevation by empirical formula provided by Kuzmichonok (1996) respectively; Hmed, Hmax and Hmin are the averages of the median elevation, highest elevation and lowest elevation of individual glaciers in the glacier system, respectively; A# is a difference
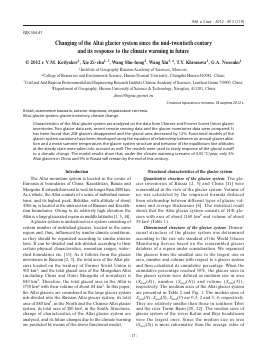
Fig. 2. Distribution of glacier area with height in the Altai Mountains
Рис. 2. Распределение площади ледников на Алтае по высоте
ture obtained from results of calculation is shown in Fig. 2 and Table 3 which indicate that the maximum area elevation (Hmax) is 3100 m, and approximately 50% of glacier area is concentrated within the range 29503250 m. Differences between the average highest elevation (#max) and the average lowest elevation (#min) of two largest watersheds (the Irtysh and Katun rivers) are 424 and 558 m, respectively.
Altitude of equilibrium line of the glacier system. In the glacier catalogues of China and USSR, the equilibrium line altitude (ELA) of glaciers in Altai was measured by method of Hess (ELAH). However, only 34% of relatively large glaciers are included into these inventories. To get the ELA of each glacier, the relationship between ELAH and Hme (the mean elevation of a glacier, which is the average value between maximum and minimum elevations of this glacier) was analyzed in the Altai glacier system, and the following empirical formula was developed:
ELAH = 0.6723Hme + 939.01; n = 490; R2 = 0.8
(1)
Comparison between ELA calculated by formula (1) and ELAH shows the average error equal to —37 m. Therefore, we used formula (1) to calculate the ELA of all glaciers. Th
Для дальнейшего прочтения статьи необходимо приобрести полный текст. Статьи высылаются в формате PDF на указанную при оплате почту. Время доставки составляет менее 10 минут. Стоимость одной статьи — 150 рублей.