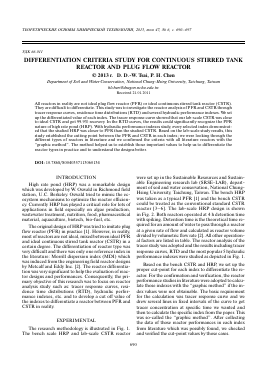
ТЕОРЕТИЧЕСКИЕ ОСНОВЫ ХИМИЧЕСКОЙ ТЕХНОЛОГИИ, 2013, том 47, № 6, с. 690-697
УДК 66.011
DIFFERENTIATION CRITERIA STUDY FOR CONTINUOUS STIRRED TANK
REACTOR AND PLUG FLOW REACTOR © 2013 г. D. D.-W. Tsai, P. H. Chen
Department of Soil and Water Conservation, National Chung-Hsing University, Taichung, Taiwan
hlchen@dragon.nchu.edu.tw Received 21.01.2011
All reactors in reality are not ideal plug flow reactor (PFR) or ideal continuous stirred tank reactor (CSTR). They are difficult to differentiate. This study was to investigate the reactor analysis of PFR and CSTR through tracer response curves, residence time distributions (RTD) and several hydraulic performance indexes. We set up the differentiated value of each index. The tracer response curve showed that our lab-scale CSTR was close to ideal CSTR and got 99.9% recovery. In the RTD curves, the results could significantly recognize the PFR nature of high rate pond (HRP). With hydraulic performance indexes study, every selected index demonstrated that the studied HRP was closer to PFR than the studied CSTR. Based on the lab-scale study results, this study established the cutting point between the PFR and CSTR in each index; we were looking through the different types of reactors in literature and we confirmed the criteria with all literature reactors with the "graphic method". The method helped us to establish those important values to help us to differentiate the reactor types in practice and to understand the designs better.
DOI: 10.7868/S0040357113060134
INTRODUCTION
High rate pond (HRP) was a remarkable design which was developed by W. Oswald in Richmond field station, U.C. Berkeley. Oswald tried to mimic the ecosystem mechanisms to optimize the reactor efficiency. Currently HRP has played a critical role for lots of applications in field especially on algae production, wastewater treatment, nutrition, food, pharmaceutical material, aquaculture, biotech, bio-fuel, etc.
The original design of HRP was tried to imitate plug flow reactor (PFR) in practice [1]. However, in reality, most of reactors are not ideal, mixed between ideal PFR and ideal continuous stirred tank reactor (CSTR) in a certain degree. The differentiation of reactor type was very difficult and there was only one reference index in the literature: Morrill dispersion index (MDI) which was induced from the engineering field reactor designs by Metcalf and Eddy Inc. [2]. The reactor differentiation was very significant to help the evaluation of reactor designs and performances. Consequently, the primary objective of this research was to focus on reactor analysis study such as: tracer response curves, residence time distributions (RTD), hydraulic performance indexes, etc. and to develop a cut off value of the indexes to differentiate a reactor between PFR and CSTR in reality.
EXPERIMENTAL
The research methodology is illustrated in Fig. 1. The bench scale HRP and lab-scale CSTR reactor
were set up in the Sustainable Resources and Sustainable Engineering research lab (SRSE-LAB), department of soil and water conservation, National Chung-Hsing University, Taichung, Taiwan. The bench HRP was taken as a typical PFR [1] and the bench CSTR could be treated as the conventional standard CSTR reactor [3—6]. The lab-scale HRP design is shown in Fig. 2. Both reactors operated at 4 h detention time with spiking. Detention time is the theoretical time required for an amount ofwater to pass through a reactor at a given rate of flow and calculated as reactor volume divided by volumetric flow rate [2]. All other operational factors are listed in table. The reactor analysis of the tracer study was adopted and the results including tracer response curves, RTD and the most popular 5 hydraulic performance indexes were studied as depicted in Fig. 1.
Based on the bench CSTR and HRP, we set up the proper cut-point for each index to differentiate the reactor. For the confirmation and verification, the reactor performance studies in literature were adopted to calculate those indexes with the "graphic method" if the index values were not obtainable. The basic requirement for the calculation was tracer response curve and we drew several lines in fixed intervals of the curve to get tracer concentration at specific time we wanted and then to calculate the specific index from the paper. This was so-called the "graphic method". After collecting the data of those reactor performances in each index from literature which was possibly found, we checked and verified the cut-point values by those cases.
Fig. 1. Flow chart of methodology in this study.
RESULTS AND DISCUSSION
ITacer response curves. The tracer response curve of the CSTR is shown in Fig. 3. Mean retention time (xmean) was equal to 258 min and was about same with theoretical retention time (t) of240 min. Lab CSTR is a "closed reactor" under a closed boundary condition [7] therefore tmean should be equal to t [8]. In Fig. 3, the CSTR was very close to ideal CSTR. The major reason was the limitation of the measure interval which made the CSTR's peak appeared in the first measurement. Theoretically, the peak should be close to ideal CSTR.
The duration of this experiment was 735 min (3.06t) and the final conductivity was 0.181 mS/cm. For RTD studies, three retention time was needed to obtain a steady state [9, 10]. And because of the background conductivity of tap-water of 0.110 mS/cm, the recovery rate was calculated as 99.9% and the result was excellent. The HRP had a longer tmean of 292 min
than t (240 min) and a reasonable good recovery rate of 92.5%, better than the only literature data, 91 and 92% [11]. Because of the special designs of inlet/outlet, paddle wheel and retention wall in HRP as in Fig. 2, HRP was formed the recirculation flow; would make suspensions flow with recirculation current and could not make the recirculation flow out completely at each run. Consequently, those designs caused an extended retention time and were the possible reasons why HRP had longer tmean.
RTD curves. The RTD (E) curves of the CSTR, the HRP and ideal reactors are shown in Fig. 4. Since E curve standardized the area under the tracer response curve to 1 [2], we could possibly make a comparison among the different reactors. The CSTR's and the HRP's curves exhibited that the hydrodynamic behaviors were between ideal CSTR and PFR. Theoretically the homogeneity of the CSTR reactor must be better than HRPs'. For this reason the peak of CSTR reac-
Top view
Side view
Paddle wheel
Baffle wall
Paddle wheel
Rotatio n axis
Motor
Inlet
0
op
° Outlet
Г L,
Rotation axis
10
U—40—»-I
-80-
10
U-40—
200
Front view Paddle wheel
----- Water level
«-120-►
200
JL_
00 A
1 4P
I
Water 00 *
level J1
Baffle wall S 4P Tl
U—40——I
U-80-
I——40—"-I
Paddle wheel
Design scheme High rate pond
Scale 1:20
Unit cm
Date 2009.03
Fig. 2. HRP design scheme.
tors would be sooner and higher than HRPs'. Both the peaks of the studied CSTR and the HRP showed in the same time at the first measurement since both the studied intervals were set as 15 min. However, it was clear that the CSTR was much closer to ideal CSTR than the HRP as shown in following. The peak of CSTR curve whose E of 0.0032 was obviously close to ideal CSTR value of 0.0042 and HRP of 0.0027 was a
little off away from ideal CSTR. In short, the HRP exhibited more PFR natures than CSTR in lab.
The E accumulated curves (so-called F curves) could be illustrated as Fig. 5. We calculated the ideal
CSTR mathematical equation (C = C0e [2] and we found 66% tracer out at t (CSTR of 56.2% vs. ideal CSTR of 66% at t). In this study, HRP 49.8% tracer out at was close to the theoretical value of "PFR in reality"
List of operational factors
Operational factor HRP CSTR
Scale Lab Lab
Detention time 4 h 4 h
Reactor design Paddle wheel with recirculation 4 L up-flow flask
Water level 15 cm -
Water volume 199 L 4 L
Inflow speed 820 mL/min 16.8 mL/min
Tracer NaCl NaCl
Inflow type Spike Spike
Mixing speed (surface speed) 10 cm/s Magnetic mixer
Effluent measure interval 15 min 15 min
of 50%. This further result proved the HRP exhibited more PFR characteristics than the studied CSTR.
Hydraulic performance indexes. Tanks-in-series
2 / 2
number N = tmean/ a characterized the non-ideal flows through a series of equal-size ideal stirred tanks [12]. They were 1.71 and 1.90 in our study for CSTR and HRP respectively. The theoretical value of N is 1 for ideal CSTR [13] as shown in Fig. 6, N of1.71 in our lab-scale CSTR was closer to ideal CSTR compared to HRP's value of 1.90. Ouarghi et al. [11] concluded N of 2 as PFR for HRP in field, and our lab N of 1.90 was very close to this value. Consequently, we concluded our HRP was approaching to PFR than CSTR mathematically.
From the Nvalues of1.71 in our lab CSTR and 1.90 in our lab HRP, we set up the cut point as 1.8 to differentiate CSTR and PFR. In literature, the reported results of N in different types of reactors are shown in Fig. 6. All the reactors claimed as CSTR had N values less than 1.8, such as N was 0.95—1 for the lab-scale disinfection reactor [14]; N = 1 was studied in the field Orbal activated sludge system [15]; N = 1.1—1.14 was in the lab scale and 1.6 in the pilot-scale membrane bioreactor (MBR) claimed by Wang et al. [16]. Even Wang's design followed our criterion; conventionally membrane process was the PFR and why were the Wang et al.'s designs as CSTRs. We thought this was the reason to explain: they put a strong air aeration which was a mixer in fact, inside the reactors, consequently whole designs turned to be CSTRs. For another lots of CSTRs' cases in literature without N values which were claimed by each author, we applied the "graphic method" to calculate the N index as follows: 1.26 in the bench-scale activated sludge process [17], 1.01—1.41 in lab electrochemical reactors [18], 0.64 in the pilot anaerobic fix-bed [19], 1.44 in t
Для дальнейшего прочтения статьи необходимо приобрести полный текст. Статьи высылаются в формате PDF на указанную при оплате почту. Время доставки составляет менее 10 минут. Стоимость одной статьи — 150 рублей.