Pis'ma v ZhETF, vol. 102, iss. 1, pp. 30-35
© 2015 July 10
Electronic structure of NaFeAs superconductor: LDA+DMFT calculations compared with ARPES experiment1)
I. A. Nekrasov+ , N. S. Pavlov+2\ M. V. Sadovskii+*
+ Institute for Electrophysics UB of the RAS, 620016 Ekaterinburg, Russia * Mikheev Institute for Metal Physics UB of the RAS, 620290 Ekaterinburg, Russia
Submitted 21 May 2015
We present the results of extended theoretical LDA+DMFT calculations for a new iron-pnictide high temperature superconductor NaFeAs compared with the recent high quality angle-resolved photoemission (ARPES) experiments on this system (see arXiv:1409.1537). The universal manifestation of correlation effects in iron-pnictides is narrowing of conducting bands near the Fermi level. Our calculations demonstrate that for NaFeAs the effective mass is renormalized on average by a factor of the order of 3, in good agreement with ARPES data. This is essentially due to correlation effects on Fe-3d orbitals only and no additional interactions with any kind of Boson modes, as suggested in the work mentioned, are necessary to describe the experiment. Also we show that ARPES data taken at about 160 eV beam energy most probably corresponds to kz = tt Brillouin zone boundary, while ARPES data measured at about 80 eV beam energy rather represents kz = 0. Contributions of different Fe-3d orbitals into spectral function map are also discussed.
DOI: 10.7868/S0370274X15130068
1. Introduction. The family of iron based high-temperature superconductors first discovered in 2008 [1] still attracts a lot of scientific attention. Experimental and theoretical works on these materials are now discussed in several extended reviews [2-5]. Detailed comparison of electronic band structures of iron pnictides and iron halcogenides, together with some related compounds was given in Refs. [6, 7].
One of the classes of iron pnictides is the so called 111 system with parent compound Lii-^FeAs with Tc = = 18 K [8, 9]. LDA band structure of the LiFeAs was first described in the Refs. [10, 11].
One of the most effective experimental techniques to probe electronic band structure of these and similar systems is the angle-resolved photoemession spectroscopy (ARPES) [12]. A review of the present day status of ARPES results for iron based superconductors can be found in Ref. [13].
Soon after the discovery of iron based superconductors it was shown both experimentally [14-18] (mainly by ARPES) and theoretically [19-22] (within the LDA+DMFT hybrid computational scheme [23]) that electronic correlations on Fe sites are essential to describe the physics in these materials. The main man-
-^See Supplemental material for this paper on JETP Letters suite: www.jetpletters.ac.ru.
e-mail: nekrasov@iep.uran.ru; pavlov@iep.uran.ru;
sadovski@iep.uran.ru
ifestation of correlations is simple narrowing (compression) of LDA bandwidth near the Fermi level by the factor of the order from 2 to 4. At the same time the topology of ARPES determined Fermi surfaces is quite similar to those obtained from simple LDA calculations, showing two or three hole cylinders around T-point in the Brillouin zone and two electron Fermi surface sheets around (tt,tt) point.
This work was inspired by recent high quality ARPES data for NaFeAs system [24] and is devoted to the detailed comparison of these results with LDA+DMFT calculations of electronic structure of this system, showing rather satisfactory agreement with these experiments. Thus, only the account of electronic correlations is sufficient to explain the major features of electronic spetrum of NaFeAs, and there is no need for any additional interactions with any kind of Boson modes (as was suggested in Ref. [24]).
2. Electronic structure. The crystal structure of NaFeAs is tetragonal with the space group PA/nmm and lattice parameters a = 3.9494 A, c = 7.0396 A. The experimentally obtained crystallographic positions are the following Fe(25) (0.75, 0.25, 0.0), Na(2c) (0.25, 0.25, zNa), As(2c) (0.25, 0.25, ZAs), zAs = 0.20278, ¿Na = 0.64602 [25]. That is quite similar to LiFeAs crystal structure [8, 10].
In Fig. 1 we show LDA band dispersions (on the right) and densities of states (DOS) (on the left) calculated within FP-LAPW method [26]. Bands in the
30
LhicbMa b >K3TO tom 102 bhh. 1-2 2015
DOS (states/eV/cell)
15 10 5 0 10 5 0 2 Or X M TZ R AM
Fig. 1. LDA calculated band dispersions (right) and densities of states (left) of paramagnetic NaFeAs. The Fermi level Ep is at zero energy
vicinity of the Fermi level have predominantly Fe-3ci character and are essentially similar to the previously studied case of LiFeAs described elsewhere [10, 11]. The As-4p states belong to the —2 to —5eV energy interval.
To perform DMFT part of LDA+DMFT calculations we used CT-QMC impurity solver [27, 28]. In order to link LDA and DMFT we exploited Fe-3ci and As-4p projected Wannier functions LDA Hamiltonian for about 1500 fc-points. Standard wien2wannier interface [29] and wannier90 projecting technique [30] were applied to this end. The DMFT(CT-QMC) computations were done at reciprocal temperature /3 = 40 with about 107 Monte-Carlo sweeps. Hubbard model interaction parameters were taken to be U = 3.5 eV and J = 0.85 eV as typical values for pnictides in general and close NaFeAs relative - LiFeAs in particular [31-33].
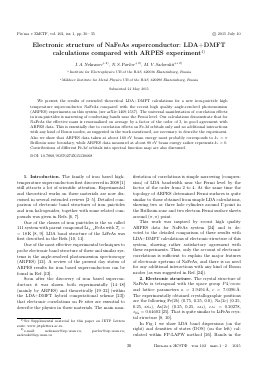
Fig. 2 shows the comparison of orbital resolved densities of states for Fe-3ci shell of NaFeAs obtained within LDA (gray dashed line) and LDA+DMFT (solid gray and black lines). Solid gray and black lines show LDA+DMFT densities of states obtained by different methods of analytic continuation. Gray lines are obtained directly from DMFT(CT-QMC) Green function G(r) by maximum entropy method [34]. Overall line-shapes of LDA+DMFT densities of states are identical to those already published in the literature for LiFeAs [31-33] and NaFeAs [33]. Most affected by correlations are Fe-3d,(t2g) orbitals xy and degenerate xz,yz. These orbitals form narrow pronounced peaks near the Fermi level. On the other hand Fe-3ci(es) orbitals 3,s2 — r2 and x2 — y2 just remind the broadened LDA densities of states.
To produce LDA+DMFT spectral function maps for direct comparison with ARPES data we need to know the local self-energy £(w). To find it we have to per-
<D " O
S 3
<D O
ts 2
Î/1 o
NaFeAs
J_i_I_i_I_i_L
LDA
LDA+DMFT (Max.ent.) ■ LDA+DMFT (Pade)
Fe-3ú?(xy)
Fe-3í/(xz, yz)
Fe-3d(3z2-r)
Fe-3 d(x2-y2)
Fig. 2. Comparison of orbital resolved densities of states for Fe-3d shell of NaFeAs obtained within LDA (gray dashed line) and LDA+DMFT (solid gray and black lines). Zero energy is the Fermi level
form analytic continuation from Matsubara frequencies to real ones. To this end we have applied Pade approxi-mant algorithm [35]. The fact that both gray and solid lines coinside well in Fig. 2 tells us, that this analytic continuation is done rather satisfactory. Corresponding self-energies for different Fe-3ci orbitals near the Fermi level are shown on Fig. 3. From the real part of self-energy we can obtain the mass renormalization factor for different orbitals: m*/mxy « 3.8, m*/mXZiyz « 3.9, m*/m3z2_r2 « 2, and m*/mx2_y2 « 1. These numbers agree well with variety of previous theoretical works for LiFeAs and NaFeAs [31-33]. Thus only the account of local Coulomb correlations on the Fe sites is enough to produce such renormalization and no extra interaction with possible Boson mode is necessary in contrast to the proposal of Ref. [24].
nucbma b >K3TO tom 102 bbin. 1-2 2015
Fig. 3. LDA+DMFT calculated self-energies for different Fe-3d orbils of NaFeAs near the Fermi level. Black lines -real part, gray lines - imaginary part. The Fermi level Ef is at zero energy
Typically experimental ARPES data are presented in a rather narrow energy interval of few tenth of eV close to the Fermi level (for LiFeAs and NaFeAs see Refs. [33,36-39]). However, in Ref. [24] ARPES data were measured down to a quite large binding energies about 6eV with rather high resolution allowing to extract different bands.
In Fig. 4 we compare experimental ARPES spectral functions for NaFeAs (left panel) [24] along the MrM high symmetry direction with LDA+DMFT calculated
Fig. 4. Comparison of experimental ARPES (left panel) [24] and LDA+DMFT (middle panel) spectral functions in the MTM high symmetry direction for NaFeAs for the wide range of binding energies containing Fe-3d and As-4p states. On the right panel maxima of experimental (crosses) [24] and theoretical (white lines) extracted from corresponding spectral functions are presented. The Fermi level Ef is at zero energy
(middle panel) spectral function map for a wide energy window. On both of these panels one can see rather high intensity region from 0 to 0.5 eV formed by quasiparticle bands near the Fermi level and then from —2 to — 5eV we can observe As-4p bands. To compare experimental and theoretical bands dispersions on the right panel of Fig. 4 we plot the dispersions for the maxima of experimental (crosses) and theoretical (white lines) spectral functions.
According to Ref. [24] ARPES bands line shapes remind very much the LDA bands, compressed by an almost constant factor of the order of 3 for all energies. By analyzing the real part of self-energies from Fig. 3 we can convince ourselves, that this correlation narrowing is essentially frequency dependent. Extended discussion of similar situation was given in our recent work on KaFe2Se2 [40]. Actually, the LDA bands located in the interval from —0.5 to 0.25 eV become more narrowed due to correlations. At larger energies, the bands stay at about the same positions as in LDA or get more spread in energy since the slope of the real part of self-energy is changed to the positive one.
As to As-4p bands ARPES experiment resolves only 2 bands instead of 6 (2 As atoms in the unit cell). Despite the general shape of the bands being quite similar in both cases, the experime
Для дальнейшего прочтения статьи необходимо приобрести полный текст. Статьи высылаются в формате PDF на указанную при оплате почту. Время доставки составляет менее 10 минут. Стоимость одной статьи — 150 рублей.