ПРИБОРЫ И ТЕХНИКА ЭКСПЕРИМЕНТА, 2013, № 4, с. 108-111
ФИЗИЧЕСКИЕ ПРИБОРЫ ДЛЯ ЭКОЛОГИИ, МЕДИЦИНЫ, БИОЛОГИИ
ENVIRONMENTAL PARAMETER MONITORING USING WIRELESS
SENSOR NETWORK © 2013 K. Vairamani, N. Mathivanan, K. Arun Venkatesh, and U. Dinesh Kumar
University Science Instrumentation Centre, Madurai Kamaraj University Madurai, Tamil Nadu, India E-mail: nmvanan@yahoo.com, vairamani_electro@yahoo.com Received July 25, 2012
The paper presents the design and deployment of Wireless Sensor Network (WSN) for monitoring environmental parameters. The system measures air temperature, relative humidity, solar radiation and barometric pressure. The system consists of a base station and a wireless sensor node. WSN ethernet gateway attached to a host PC serves as the base station in the network. WSN measurement node with necessary sensors and signal conditioners serves as the wireless sensor node. The wireless sensor node measures the parameters and transfers the data to the base station. An application program has been developed on LabVIEW platform and executed in the host PC for data acquisition, processing, and plotting of the measurement data on a graphical chart. The program also saves the data in a file for history review and analysis. Hardware and software development of the system are discussed. Typical measurements with the present system are reported.
DOI: 10.7868/S0032816213040149
1. INTRODUCTION
Measurement of environmental parameters such as air temperature, relative humidity, solar radiation, atmospheric pressure is important in wide range of meteorological, climate monitoring and diverse engineering applications. Wireless sensor networks (WSN) have been extensively used in applications such as health monitoring [1, 2], home automation [3], automobile monitoring [4], green house monitoring [5] etc. WSN are also used in environmental monitoring [6]. WSN technology has the advantage of deploying sensors in hostile environments and communicating the measurement data through wireless media. A WSN based monitoring system using NI WSN devices and LabVIEW has been designed and deployed to monitor the environmental parameters of a remote area. The system measures the parameters and transmits the data to a host PC through a wireless media for plotting the trends.
2. SYSTEM DESIGN
The system comprises of a base station and a wireless sensor node. A PC attached with a NI WSN-9791 gateway coordinator serves as a base station. Temperature, relative humidity, solar radiation and barometric pressure sensors with associated signal conditioners attached to NI WSN-3202 serves as a wireless sensor node. Fig. 1 shows the block diagram of the system.
The NI WSN devices use the ZigBee (IEEE 802.15.4) wireless communication protocol and operates in ISM band, 2.4 GHz frequency. NI WSN devices can communicate up to 300 m in open space and support data
communication rate up to 250 kbps. The WSN-9791 gateway can collect measurement data from up to 36 measurement nodes in a network and transfer data to a host PC through 10/100 Mbps ethernet port. The measurement node NI WSN-3202 has four analog input channels and four digital I/O channels. Each analog input channel has 16-bit resolution.
The wireless measurement node uses RHT-1000 temperature and humidity transmitter module for measuring air temperature and relative humidity. The module has Pt-100 RTD temperature sensor, HIH4000 humidity sensor and associated signal conditioners. The module provides outputs in the range of 0—1 V for temperature 0 to 100°C and for relative humidity 0 to 100%RH. The module has the sensitivity of10 mV/°C in temperature measurement and 10 mV/%RH in relative humidity measurements. The outputs are further amplified with gain 5 using LM324 op-amp in non-inverting amplifier configuration. The op amp outputs are applied at AI0 and AI1 analog inputs ofWSN-3202. Silicon photodiode based pyranometer from Davis instruments is used for solar radiation measurement. It measures solar radiation from 0 to 1800 W/m2 and provides voltage output in the range of 0—3 V. It has the sensitivity of 1.67 mV/W/m2. NPA-500 IC pressure sensor is used for barometric pressure measurement. It measures pressure from 0 to 1034 mbar and provides voltage output in the range of 0.5—4.5 V. It has the sensitivity of 3.86 mV/mbar. The barometric pressure sensor and solar radiation sensor outputs are buffered using LM324 op-amp and applied at A12 and A13 analog inputs of the WSN 3202. The circuit diagram is shown in Fig. 2.
Fig. 1. Block diagram of the system.
Fig. 2. Circuit diagram of the signal conditioner.
110
VAIRAMANI h gp.
36 34 32 30 28 26
1000 800 600 400 200 0
25 24
22
20
18
16 15
09:01 AM 06/06/2012
(a)
(c)
(e)
06:00 PM 12:00 AM 08:56 AM 06/06/2012 06/07/2012 06/07/2012 Time
75
is 70
tive Hum % RH 65 60 55
Re 50 45
£ 1020
g
e 1015
-ometric pi mbar 1010
1005
(b)
a
PQ
1000
09:01 AM 06/06/2012
06:00 PM 12:00 AM 08:56 AM 06/06/2012 06/07/2012 06/07/2012 Time
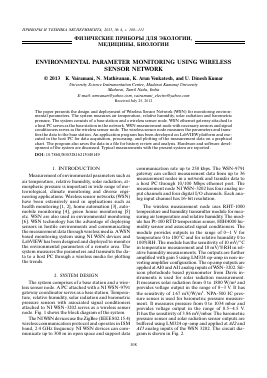
Fig. 3. Measurements for 24 h of environmental parameters: (a) air temperature; (b) relative humidity; (c) solar radiation; (d) barometric pressure; (e) dew point temperature.
The dew point is the temperature below which the water vapor in a volume of humid air at a constant barometric pressure condenses into liquid. It is associated with relative humidity. Dew point temperature is calculated from the air temperature and relative humidity using the Magnus formula [7]. It is given as
b
Td =
in (RH) +
, \100/ b + T.
- in (RH \100
aT
(1)
b + T
where Td, °C, is the dew point temperature; T, °C, is air temperature; RH, %, is relative humidity; a and b are Magnus constants which are given as 17.27 and 237.7°C respectively.
3. SOFTWARE DEVELOPMENT
The wireless sensor network is configured using NI WSN Pioneer tool kit and Measurement & Automation Explorer (MAX) utility software as given below.
1. A fixed IP address and a fixed node ID are assigned to the gateway and the measurement node.
2. The measurement node is programmed to return all the 4 analog input channels data on receipt of a request from the base station.
An application program (a LabVIEW 'VI') has been developed on LabVIEW platform and executed in the host PC.
The application VI performs the following functions.
1. Initialization: The VI establishes the communication link between the host PC, the WSN gateway (NI WSN-9791) and the measurement node (NI WSN-3202) using the IP address of the gateway and node ID of the measurement node. It creates a file with a given name and keeps open to save the measurement data till the data acquisition program is stopped. A sampling interval is specified for data acquisition.
2. Data acquisition: The VI sends a command to the measurement node to return the measurement data. In response, the measurement node samples the analog input channels and returns the data in spreadsheet string format to the VI. Repeats the data acquisition at specified sampling interval.
3. The VI computes the air temperature, relative humidity, solar radiation and barometric pressure values using the data it received from the measurement node. The VI reads the system time from RTC and plots the measurement values against the time on graphical charts. The VI also computes and plots the
a
dew point temperature using air temperature and relative humidity values.
4. The VI converts the parameter values into a string, appends the system time and writes the string in the data file. So, the file contains the measurement values and the instants of data received.
5. History review: The VI includes a function to retrieve the data saved in a file and plot on a chart. It enables the history review operations.
6. Print: The VI includes a function to support printing of interested part of the plot.
4. RESULTS AND DISCUSSION
The temperature, relative humidity and barometric pressure sensors are placed in a radiation shield enclosure and the solar radiation sensor is placed exposing its surface to direct sun light. The system has been used to measure the environmental parameter values for 24 h from 9.01 AM in a day at interval 5 min. It results in 288 measurements in a day. The system plots the measurement values on graphical charts as shown in Fig. 3.
System response time. The average response time of the system is found by computing the time the system takes to return 1000 measurement values after the requests for the data are generated from the host PC. It has been found that the 1000 data have been ac-
quired at the host PC in 6.63 min. Hence, the average response time of the system is computed as 398 ms.
Time stamping. Since the RTC of NI WSN-3202 measurement node cannot be initialized with the gateway NI WSN-9791, in the present measurement the time at which the data is received at the host PC is considered as the time of data acquisition. It is read from the system RTC and used for time stamping. With NI WSN-9792 the WSN real-time gateway, the RTC of measurement node can be initialized and the time at which the signals are sampled can be received at the host PC and used for time stamping.
REFERENCES
1. Pandian, P.S., Safeer, K.P., Pragati Gupta et al., Journal of Networks, 2008. V. 3. № 5. P. 21.
2. Elango, S., Mathivanan, N., and Arunvenkatesh, K., Jl. of the Instm. Soc. of India, 2011. V. 41. № 4. P. 233.
3. Elango, S., Mathivanan, N., and Pankaj Kumar Gupta, Jl of Instm. Soc. of India, 2011. V 41. № 2. P. 115.
4. Jorge Taveres, Fernando, J. Vslez, and Joao M. Ferro, Measurement Science Review, 2008. V. 8. № 3. P. 65.
5. Dae-Heon Park and Jang-Woo Park, Sensors, 2011. V. 11. № 4. P. 3640.
6. Martinez, K., Hart, J., and Ong, R., IEEE Computer, 2004. V. 37. P. 50.
7. Lawrence Mark, G., Bulletin of the American Metero-logicalSociety, 2005. V. 86. № 2. P. 225.
ПРИБОРЫ И ТЕХНИКА ЭКСПЕРИМЕНТА
№ 4 2013
Для дальнейшего прочтения статьи необходимо приобрести полный текст. Статьи высылаются в формате PDF на указанную при оплате почту. Время доставки составляет менее 10 минут. Стоимость одной статьи — 150 рублей.