НЕЙРОХИМИЯ, 2011, том 28, № 2, с. 149-154
ЭКСПЕРИМЕНТАЛЬНЫЕ РАБОТЫ
YM 577
ETHANOL INDUCES A REDUCTION IN CORTICAL THICKNESS, NEURONAL DENSITY AND SOMATIC SHRINKAGE IN THE CEREBELLAR CORTEX OF ADULT MICE © 2011 Q. F. Zhu", C. Z. Zhang", *, T. M. HuaA
aSchool of Life Sciences, Anqing Teachers College, Anqing, China bSchool of Life Sciences, Anhui Normal University, Wuhu, China
Abstract—Ethanol-induced impairments to the structure of the cerebellar cortex were investigated in adult mice treated with ethanol. Alcohol (15%) was given to a group of mice (Group E), and the mice in the control group (Group C) were allowed to drink pure tap water. After 3 months, animals were sacrificed and processed for histological observations of the cerebellar cortex using Nissl staining. The thickness of each cortical layer, the density of neurons and the diameter of Purkinje cell (PC) soma were measured under light microscope. The results showed that the cerebellar cortex in Group E exhibited a significant decline in the thickness of the cortical cortex and neuronal density, and remarkable atrophy in PC soma occurred when compared to the control group. Our findings indicate that ethanol induces a decline in cortical thickness, loss of cortical neurons and atrophy in neuron volume, which might lead to cerebellar shrinkage after long-term alcohol abuse. Neuronal atrophy may be caused by loss of cytoplasmic matrix and cellular organelle degeneration, resulting in a reduction in substance synthesis and energy supply in neurons. A decrease in cerebellar circuitry due to neuronal loss might mediate a decline in cerebellar function in ethanol-treated mice.
Keywords: ethanol, cerebellar cortex, structure, mice.
INTRODUCTION
Ethanol is a neurotoxic substance. Chronic abuse of ethanol leads to serious brain dysfunctions, such as motor incoordination, neuropsychological deficits, risk of essential tremor, cognitive and learning impairments, as demonstrated by various clinical investigations and in animal experiments [1—5]. The cerebellum is believed to be the most vulnerable brain region to ethanol insult in the central nervous system [6]. The cortex is of particular research interest because it is responsible for functional planning and processing [7]. Ethanol-induced alterations in the cerebellum have already been widely documented, including retardation in early development [8, 9], atrophy in the volume [10], retrogression of dendritic arbors of Purkinje cells (PCs) [11, 12], decline of the synapses in PCs [13, 14], dilation of the smooth endoplasmic reticulum (SER) in PCs and in parallel fibers [15—19], and alterations in the firing properties of PCs [1]. These ethanol-re-lated changes are mostly reported in postnatal or aged rats [17, 20]. However, whether ethanol induces changes of structures of cortical layers, neuronal density and PC configurations in adult animals remain largely unclear. Here, we carried out a quantitative comparison of the thickness of cortical layers, density of neurons and diameter of PCs in the cerebellar cor-
* Corresponding author; address: School of Life Sciences, Anqing Teachers College, 128 South Linghu Road, Anqing, Anhui 246011, P.R. China; e-mail: neurobiologyzhang@yahoo.com.
tex of adult mice with or without ethanol treatment, in order to provide data for exploring the mechanisms of ethanol-induced cerebellar dysfunction, such as ataxia and gait disturbance [6, 21].
MATERIALS AND METHODS
Animal Model
A total of forty 3-month old male Kunming mice (25—30 g body weight, Experimental Animal Center, Anhui Medical University, P. R. China) were randomly divided into two groups: Group E was animals (n = 20) administered to drink the solution of 15% (v/v) ethanol; Group C was animals (n = 20) given pure tap water. Sufficient rodent diet (pellets) were supplied at 11:00 and 20:00 every day. The breeding lasted 3 months, during which the mice were monitored daily and weighed weekly to evaluate health status. Approximate 4 ml of ethanol solution was consumed by each animal daily in Group E. The experimental treatments were in agreement with the National Institute of Health Guide for the Care and Use of Laboratory Animals.
Balance Beam Test
The balance beam was a static rod of 1 m in length and 2 cm in diameter, suspending 80 cm over a soft cushion. A piece of chipboard (8 cm x 8 cm) was set at
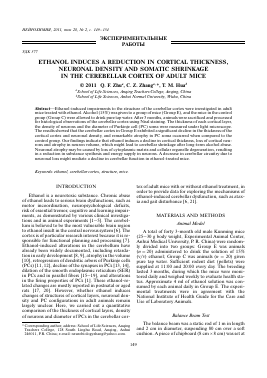
Fig. 1. (a) Structure of the cerebellar cortex in the control mice (Group C). (b) Structure of the cerebellar cortex in the mice treated with ethanol (Group E). (c) Structure of the cerebellar cortex in Group C mice. (d). Structure of the cerebellar cortex in Group E mice. Animals in Group E (b, d) showed a decline in the thickness of the molecular layer, granular layer, total cortical layer and folia of cerebellar cortex as well as the neurons in various layers when compared with those in Group C (a, c). f: folia; ml: molecular layer; pc: Purkinje cell; gl: granular layer; sm: the subcortical medulla. (Figures a and b have the same scale bar, Figures c and d have the same scale bar. Scale bar = 100 p,m).
one end of the rod, and a chipboard box (10 cm x 10 cm x 8 cm) was placed at the other end of the rod as a nest to motivate the mice traversing the beam. Each mouse was trained to walk across this rod once per week during the first month. At the end of the third month of feeding, the time that each mouse taken to traverse the rod was tested three times with 30 min at the interval, and the average time was calculated as the behavior score.
Tissue Preparation
For histological observations, four mice were randomly selected from each group and anesthetized with urethane (400 mg/kg i.p.). Once the reflexes were completely abolished, 10 ml of 0.9% NaCl containing 50 mg heparin was perfused through the left ventricle, followed with 10 ml of fixative solution containing 4% paraformaldehyde and 2.5% glutaraldehyde in 0.1 M phosphate buffered saline (PBS, pH 7.4). After perfusion, the cerebellum were dissected out and immediately immersed in the fixative solution for 4 hours
(4°C). The tissue blocks of the anterior lobes were used in each group for easy comparison.
Nissl Staining
The blocks of the anterior lobes were trimmed into a cuboid shape and postfixed in the fixative solution overnight. The tissues were then routinely embedded in paraffin. Consecutive coronal sections (6 ^m in the thickness) were cut. Five sections with 30 ^m apart from each were selected for 0.5% toluidine blue staining.
Quantitative Analysis
Eight visual fields from each Nissl-stained section were randomly selected for quantification under a microscope (Motic China Group Co., Ltd). Under the magnification of 100 x, the thickness of the molecular layer, the granular layer, the total cortex and the folia (Figures 1a and 1b) were measured at the lobular flanks where the cortical layers were almost parallel to the panel of the white matter. Under the magnification of400x, the number of PCs was counted using an eye-
Behavior results and morphological parameters of cerebellar cortex in Group E and Group C mice
Group C Group E
Time walking across the rod (s) 8.08 ± 1.50 14.66 ± 6.78*
Thickness of molecular layer (p.m) 142.67 ± 30.35 125.03 ± 18.81*
Thickness of granular layer (p.m) 125.71 ± 24.26 120.00 ± 20.22#
Thickness of total cortex (p.m) 271.55 ± 39.36 249.26 ± 28.45*
Thickness of folia (p.m) 561.43 ± 68.59 516.15 ± 61.27*
Density of neurons in molecular layer (cells/mm2) 2696.55 ± 1153.65 2064.49 ± 887.03*
Density of granular cells (cells/mm2) 43833.33 ± 13646.34 33722.22 ± 10925.21*
Linear density of Purkinje cells (cells/mm) 13.33 ± 4.80 10.48 ± 3.44*
Diameter of Purkinje cell body (p.m) 12.15 ± 1.70 10.56 ± 2.08*
Notes: * — P < 0.01 and — P < 0.05 (t-test), significant differences as compared to Group C, respectively. The data are presented as M ± m. The number of animals in each group n = 4 except for the behavior results, 20 for Group C and 17 for Group E.
piece micrometer and their linear density was then calculated (cell number/mm), whereas the number of neurons in the molecular layer and granular layer were counted in a calibrator, and then the density (cells/mm2) was calculated. At magnification of 1000x, the diameter of PC soma was measured only from the cells with clear cell body and distinct nucleus. A total of eight randomly selected PCs were measured from each section. The diameters were then estimated using the following formula as described previously by Muche et al. [20]: the diameter ofPC soma: d = (a x b)1/2 (where a and b are the longitudinal and transversal diameters of a PC, respectively).
It should be noted that the methods for measurement of the thickness of layer and cell counting could be accurately made by stereological technique, and our quantitative analysis might be biased to an unknown degree due to the simply visual examination. However, the results should not be affected since the same criteria were used for both groups during the measurement.
Statistical Analysis
The data were expressed as mean ± standard error of the mean (M ± m). Statistical comparisons were made by independent sample t-test, and a P value of <0.05 was considered statistical significant.
RESULTS
General Observations During Breeding
Shortly after administration of the ethanol, the animals showed obvious behavioral signs of alcoholism, such as narcoma, tachycardia and twitching. However, the symptoms vanished after a few hours. During this treatment, a total of 3 animals died, which were presumed to have ingested an excessive dose of alcohol. Haemorrhage was found in the posterior region of the brain without conspicuous pathological changes in other organs, which was in consistence with a previous study [20].
Ethanol-Induced Significant Impairment in Neurological Behaviors
The ethanol-treated mice showed obvious trepidation and dread when staying on the rod with their abdomen clinging to the rod and gait distu
Для дальнейшего прочтения статьи необходимо приобрести полный текст. Статьи высылаются в формате PDF на указанную при оплате почту. Время доставки составляет менее 10 минут. Стоимость одной статьи — 150 рублей.