ГЕНЕТИКА РАСТЕНИЙ
УДК 575.17:582.736
GENETIC VARIABILITY AND DIFFERENTIATION OF Caragana microphylla POPULATIONS AS REVEALED BY RAPD MARKERS
© 2011 X. H. Chen1, 2, Y. B. Gao1
department of Plant Biology and Ecology, College of Life Science, Nankai University, Tianjin 300071, China
e-mail: ybgao@mail.nankai.edu.cn 2College of Bioscience and Biotechnology, Shenyang Agricultural University, Shenyang 110866, China
e-mail: chenxh017@hotmail.com Received July 03, 2009;
In final form, July 29, 2010
Genetic variability in random amplified polymorphic DNA (RAPD) was studied in 90 individuals of Caragana microphylla, an outcrossing perennial shrub species, from five natural populations sampled in Inner Mongolia steppe of China on a small scale. Nineteen selected primers were used to amplify DNA samples, and totally 225 bands were detected. The percentage of polymorphic bands within populations ranged form 58.22% to 63.56%, with an average of 60% at the population level and 71.11% at the species level, indicating relatively high genetic variations in C. microphylla species. Shannon's information index (I) and Nei's gene diversity (h) showed the similar trend with each other. According to the analysis of Nei's gene diversity, the percentage of genetic variation among populations was 7.13%, indicating a low level of genetic differentiation among populations. There existed a strong gene flow (Nm = 3.26) among populations. Although AMOVA analysis also revealed most variation was within populations (Ф^ = 4.1%), a significant proportion was observed among populations (P < 0.001) in the present study, suggesting genetic differentiation occurred among populations at a certain extent. Based on Mantel's tests and the results of previous studies, the genetic structure pattern of C. microphylla accorded with the isolation-by-distance model on a very large scale, however, on a small scale, the significant genetic differentiation among populations might be enhanced by the micro-environmental divergence among the sampling sites, rather than by geographic factors. Analysis of the genetic variations of C. microphylla populations provided useful information for the adaptive strategy of Caragana species.
Caragana microphylla, a long-lived perennial shrub species belonging to Leguminosae family, has a wide range across the typical and meadow steppe zones of the Inner Mongolia Plateau of China. It is well known for the ability of drought resistance [1]. When the majority of species die out after several consecutive years of drought, it can still be able to grow rather normally, and for this reason, it is known as "life-saving plant" for the livestock in the areas of grassland agriculture. Meanwhile, as one of the important species in the green protective defense for Beijing-Tianjin area, C. microphylla plays a critical role in the environmental protection in the arid area in northern China [2], and is frequently used for rehabilitation of degraded land by fixing atmospheric nitrogen, enhancing water conservation and reducing wind erosion by forming shrub belt or vegetation [3]. The species has also been used as livestock fodder, green fertilizer, fuel, honey resource and medicinal substances [4].
C. microphylla is an insect-pollinated species with ability of vigorous clonal growth as well as normal sexual reproduction [5]. It usually produces a large number of seeds, but only a few of them can germinate and survive under harsh natural conditions. The species has distinct geographical and morphological variability with respect to quantitative characters, especially
length and width of leaf and of seed, length of pod, and number of seeds per pod [6]. Because of the high ecological and economical values, geographical distribution [7], taxonomical status [8], morphology and anatomy [9], and physiology [10, 11] for C. microphylla have been well-documented. Although molecular techniques have been increasingly applied to analyze the taxonomy, population genetic structure and phylo-genetic relationships within and among some species in the genus Caragana [12—15], only a preliminary study of the genetic diversity and population structure of C. microphylla in Inner Mongolia steppe has been conducted in our laboratory [16], and whether there exists an effects of environmental changes on its genetic structure remains unknown.
Molecular techniques have provided new markers for the study of genetic variation [17—20]. Among these techniques, random amplified polymorphic DNA (RAPD) marker has been successfully used in population genetic studies of a large number of plant and animal species, and has proved to be a powerful tool for assessing genetic variations within and among populations [21, 22]. In the present study, we used RAPD technique to analyse genetic variations within and among populations in five natural populations of C. microphylla found in Inner Mongolia steppe of Chi-
Fig. 1. Geographic distribution of the five natural populations of Caragana microphylla in Inner Mongolia steppe, China. Distances between the populations: Pop1—Pop2, 0.4 km; Pop2—Pop3, 21.5 km; Pop3—Pop4, 4.1 km; Pop4—Pop5, 15.4 km.
na. We investigated the levels of genetic diversity distribution within and among these populations, established the genetic relationships and estimated whether there existed a genetic differentiation among populations from geographic distances or environmental conditions.
MATERIALS AND METHODS
To investigate the genetic diversity within and among populations of C. microphylla, five natural populations in the middle and eastern parts of Inner Mongolia steppe in China were selected, and the internals between populations were from 0.36 to 26 km which
Table 1. Location and habitat characters of the five populations of Caragana microphylla
Location and habitat characters Populations
Pop 1 Pop2 Pop3 Pop4 Pop5
Longitude (E) 116°29'59'' 116°29'43'' 116°15'12'' 116°12'10'' 116°22'51''
Latitude (N) 43°50'20'' 43°50'21'' 43°55'21'' 43°55'35'' 43°52'32''
Altitude (m) 1128 1123 1130 1083 1160
Soil pH 7.01 7.00 7.07 6.56 6.47
Soil organic matter content (g kg-1) 10.05 11.21 14.42 7.08 28.14
Soil total N content (g kg-1) 0.53 0.67 0.70 0.41 1.01
Soil available N content (g kg-1) 0.19 0.22 0.26 0.16 0.09
Soil total P content (g kg-1) 0.19 0.19 0.20 0.12 0.27
Soil C : N ratio 11.85 9.71 11.52 10.10 16.52
Soil N : P ratio 3.13 3.47 3.46 4.66 3.75
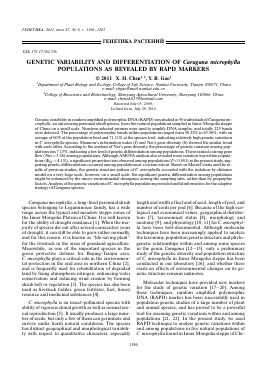
Fig. 2. Amplification pattern of Caragana microphylla with RAPD primer of OpA13. 1, Pop1-1; 2, Pop1-2; 3, Pop1-3; 4, Pop1-4; 5, Pop1-5; 6, Pop1-6; 7, Pop1-7; 8, Pop1-8; 9, Pop1-9; 10, Pop1-10; 11, Pop1-11; 12, Pop1-12; 13, Pop1-13; 14, Pop1-14; 15, Pop1-16; 16, Pop1-17; 17, Pop1-18; 18, Pop1-19; M, Marker.
represented a narrow geographic pattern (Fig. 1). Corresponding to each population, longitude, latitude, altitude, soil pH, soil organic matter content, soil total N content, soil available N content and soil total P content were determined for further analysis (Table 1).
Eighteen individuals per population were collected randomly with a minimum of10 m between each other to avoid sampling from the same consanguinity. Young leaves were dried in silica gel and stored at room temperature for DNA extraction. Genomic DNA extraction, RAPD-PCR amplification, and electrophoresis were performed as described earlier [23, 24]. A total of 100 primers from Operon (Kit A, I, N, M and Q) were screened for amplification on C. microphylla and 19 primers were selected for further investigation. The primers used were 0pA03, 0pA04, 0pA10, OpA11, 0pA13, OpA19, OpA20, OpN04, OpN05, OpN06, OpN10, OpN13, OpN14, OpN15, OpN18, OpQ01, OpQ05, OpQ06 and OpQ16.
Amplified bands were scored in a size range from 200 to 2000 bp, and the bands were scored as "1" for presence and "0" for absence excluding the smeared and weak ones by visual inspection. The resulting binary data matrix was analyzed using POPGENE version 1.32 program [25]. Genetic diversity indexes within and among populations were calculated including the percentage of polymorphic bands (PPB), the observed number of alleles (na), the effective number of alleles (ne), Nei's gene diversity (h) and Shannon's information index of diversity (I). Genetic differentiation among populations was measured by coefficient of gene differentiation (GST). Gene flow (the average number of migrants exchanged among populations per generation, Nm ) was calculated using the GST estimates according to the equation Nm = (1 — GST)/4 GST. All of the calculations were estimated based on the assumption that these populations were in Hardy—Weinberg equilibrium. Genetic divergence between any pair-wise populations was estimated using Nei's unbiased genetic distances and genetic identities, and a dendrogram was constructed by an unweighted paired group method of cluster analysis using UPGMA of NTSYS-pc program
in order to examine the genetic relationship at the species level [26]. Isolation of populations by geographic distances and micro-environmental divergence were estimated respectively by Mantel's test of the Arlequin ver. 3.0 software package [27] with 3000 auto permutations using Nei's unbiased genetic distances between any pair-wise populations. In addition, the coefficient of genetic differentiation among populations (Ost) was also estimated using the AMOVA analysis of the Arlequin ver 3.0 software package [27] to estimate the genetic divergence level of these five C. microphylla populations, and their significance levels for variance was tested with 3000 auto permutations among individuals within populations and among populations.
RESULTS
Among the 90 individuals, RAPD analysis with 19 selected primers generated a total of225 bands ranging in size from 200 to 2000 bp, with an average of 11.8 bands per primer (randomly showed photos of amplified DNA with four primers in Fig. 2—5). Of these bands, 160 were polymorphic and the percentage of polymorphic bands (PPB) was 71.
Для дальнейшего прочтения статьи необходимо приобрести полный текст. Статьи высылаются в формате PDF на указанную при оплате почту. Время доставки составляет менее 10 минут. Стоимость одной статьи — 150 рублей.