Glacier mass balance, climate and sea level change
M. Dyurgerov1, M. Meier2
University of Colorado at Boulder, 2Institute of Arctic and Alpine Research, Boulder, Colorado, USA
Статья поступила в редакцию 1 декабря 2005 г. Представлена главным редактором В.М. Котляковым
Обсуждаются крупномасштабные эффекты всех многолетних масс льда на поверхности Земли, за исключением ледниковых покровов Гренландии и Антарктиды, оценен их объем и вклад в рост уровня Мирового океана в связи с изменениями климата.
Introduction
Global warming and other ongoing changes in the Earth system are beginning to have significant impacts, not only on the physical environment, but also on the biosphere and society. Thus, it is important to be able to project future trends, and this means that we must understand the present forcings and effects on the system — including the wastage of glaciers — in order to plan for the future. Glacier variations are sensitive indicators of changes in climate [4, 58] and may have direct impacts on processes of global importance such as sea-level rise [48], the hydrology of mountain-fed rivers [3, 38], the freshwater balance of the oceans [9], natural disasters [4], and even the shape and rotation of the Earth [20]. In recent years the rate of loss of glacier ice to the oceans has accelerated [31], and this trend is expected to continue as a result of the rise of «greenhouse» gases in the atmosphere. At the same time, we are becoming increasingly able to measure subtle changes in the Earth system using satellites and other new technology. Thus, it is appropriate to examine the current role of glaciers in global processes.
Here we discuss the effect of all perennial ice masses other than the Greenland and Antarctic ice sheets. We include mountain glaciers, ice fields, ice caps, and all kinds of glaciers, including those that are temperate, polar, or
polythermal; we do not include outlet termini of the two ice sheets, but we do include those glaciers and ice caps that are peripheral to, and independent of, the ice sheets.
Glacier area
The World Glacier Inventory Program (WGI) was an ambitious attempt to measure and classify all of the perennial ice masses of the world [74]. However, an inventory of glaciers and ice caps could only be completed in certain areas, such as mountain and subpolar regions in Former Soviet Union, China, Nepal European Alps. Many important regions could not be measured. Therefore, the WGI is inherently biased and has to be extended by more approximate techniques, e.g., as suggested by the Global Land Ice Measurements from Space program [39].
Some recent estimates of the total area and volume of glaciers and ice caps are given in Table 1. Our estimates of the total area of this ice is about 785±100x103 km2; its volume is about 260±65x103 km3, equivalent to about 0.65±0.16 m of sea-level change.It is interesting that almost half of this estimated volume occurs around the periphery of the Antarctic and Greenland ice sheets.
Large differences exist between the volumes estimated by different authors depending on the assumptions
Table 1
Total areas and volumes of glaciers around Greenland and Antarctic and elsewhere, as reported by several recent sources
Source* Area, 103km2 Volume, 103km3 Total
12 12 area volume
Meier and Bahr [49] 540 140 680 180
Raper and Braithwaite [62] 522 87 522 87
Ohmura [59] 521 51 521 51
Dyurgerov [25] 540 245 785
This paper** 540±30 245±100 133***±20 125***±60 785±100 260±65
*1 — excluding Antarctica and Greenland, 2 — Antarctica and Greenland, not including the Antarctic and Greenland ice sheets. Uncertainties are estimated based on possible errors in area, the area/size relation, and the scatter in the power-law rela-
tion of area and volume.
***Obtained by separating out the Antarctic and Greenland glacier area/size distribution as calculated by Meier and Bahr [49], and increasing it by using the newer (larger) area and the same mean thickness determined for polar and subpolar glaciers as given in Meier and Bahr [49].
used and the method of calculation. Even larger differences between the various estimates shown in Table 1 are due to whether or not the peripheral glaciers around the two ice sheets are included. Some authors assume that these peripheral glaciers will be analyzed as part of the ice sheets, but we note that these small glaciers are at lower altitudes, in more maritime climates, and are too small to be included realistically in the coarse grids used to model the big ice sheets. As pointed out by Vaughn [72]), «the glaciers of the Antarctic Peninsula have] greater similarity to sub-polar glacial systems (such as coastal Greenland, Svalbard, Patagonia and Alaska) which are known to be more sensitive to atmospheric warming, than to the cold ice sheets covering the rest of the Antarctic continent...»
Area distribution. The distribution of individual glaciers by size is important to know in order to calculate their thickness and thus how rapidly their contribution to runoff to the sea will change as they are reduced in size. The existing WGI results need to be extended, not only to Antarctica and Greenland, but also elsewhere, using some kind of realistic model, especially in regions of large glaciers such as those in the Arctic islands and around the Gulf of Alaska. Meier and Bahr [49] and Bahr and Meier [12] suggested that the number of glaciers in a region as a function of their size could be approximated by an exponential/power-law function, derived from percolation theory and tested against inventory results. As mentioned by Meier and Bahr [49], glaciers larger than 213 (8192) km2 make up a significant portion of the total area; if more glaciers around the Antarctic ice sheet were included, the area of large «small glaciers» would increase. More analysis, modeling, and testing are vitally needed.
Ice thicknesses and volumes. Once the distribution of glaciers as a function of their individual areas has been defined, using glacier inventories and a scaling analysis, the distribution of glacier thicknesses and volumes can be calculated. These are important for projecting the glacier contribution to sea-level rise in future years; the areas of thin glaciers will decrease rapidly with wastage, but thick glaciers will continue to produce meltwater long into the future. We use a volume/area scaling algorithm [2, 13] with bins 2n in area to estimate glacier-volume and thickness distributions and thus their likely area changes with further melting. This value for total glacier volume (Table 1) is considerably higher than the values reported by some other authors.
Traditionally, attention has been paid to variations in the length of glaciers — their advance and retreat [34, 36, 57]. Although useful for demonstrating changes, these data give only crude measures of the glacier's overall changes unless detailed knowledge is available for modeling their dynamic response to mass balance change. This knowledge is available for only a few glaciers, and therefore these advance/retreat histories are of limited use for large-scale syntheses of year-to-year climate change or sea-level rise. Here we direct our attention to the annual (or net) balance of glaciers; this is a direct measure of the exchange of ice mass between the atmosphere and the land/ocean.
Mass balance
Glacier mass balances can be measured several ways. The most common are (1) repeated measurement of the ice surface altitude; these data on thickness changes, combined with glacier area and an appropriate density, yield changes in mass; and (2) mass balance
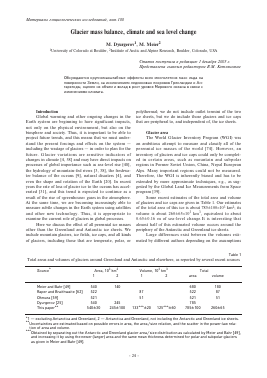
Fig. 1. Map showing locations of glaciers with mass balance records Рис. 1. Ледники, на которых проводились измерения баланса массы
observations made directly on the surface which are summed over the glacier and over a year to get the glacier-wide mass changes, the net or annual balance. The surface-altitude method has recently become especially productive because of the development of laser altimeters that can be flown in aircraft using global positioning systems (GPS) for spatial orientation [6, 10, 32, 40].
Most mass balance data from the world's glaciers have been obtained by traditional surface measurements; however, these are limited because they are very labor intensive. An extensive literature exists on mass balance methods [46, 61], and results have been compiled by the World Glacier Monitoring Service (WGMS) in Zürich, Switzerland, and the National Snow and Ice Data Center (NSIDC) in Boulder, Colorado; see also the data sets by Cogley [16] and Dyurgerov [24, 25]. In addition, numerous attempts have been made to model mass balance time series using climate data [56], but here we emphasize observational data to avoid circularity in studies of the relation of glacier changes to climate. The locations of glaciers with mass balance observations listed here are shown in Fig. 1.
Global compilation of mass balances. The area of glaciers considered here includes areas of individual ice caps in Antarctica, i.e., those that have no direct connection with the ice sheet and were not included in previous evaluations. There is evidence that many of these glaciers have a negative mass balance and are now contributing meltwater to sea-level rise [18, 52, 53, 65, 68, 69]. Regional glacier areas can be downloaded from our recent computation [31]. In order to assess the global effects of glacier wastage, we need to
compile glacier volume changes for large regions. Difficulties exist for data averaging because the data are unevenly distributed (for some regions we have only one, or no, time series of glacier volume change), and there are unresolved problems with spatial extrapolation of glaciological data. Glacier mass balance data are extremely variable with respect to many local, regional, and global parameters such as longitude, latitude, elevation, aspect ratio, and distance from sources of moisture [24]. These factors ar
Для дальнейшего прочтения статьи необходимо приобрести полный текст. Статьи высылаются в формате PDF на указанную при оплате почту. Время доставки составляет менее 10 минут. Стоимость одной статьи — 150 рублей.