ТЕОРЕТИЧЕСКИЕ ОСНОВЫ ХИМИЧЕСКОЙ ТЕХНОЛОГИИ, 2010, том 44, № 2, с. 214-217
УДК 548.562
INDUCTION TIME OF HYDRATE FORMATION IN A FLOW LOOP
© 2010 M. Sarshar, F. Esmaeilzadeh and J. Fathikalajahi
Shiraz University, Shiraz, Iran fathi@shirazu.ac.ir Received 30.01.08; in final form, 06.07.09
A set of experiments were developed to study the effect of the supersaturation on the induction time of the hydrate formation in a flow loop. Propane, carbon dioxide and a mixture of methane and propane were used to form hydrate in the loop. Induction time was measured with varying temperature and pressure which gave rise to change in the supersaturation. It was found that induction time was indirectly dependent on the supersaturation in all experiments. Measured values of induction time were in the range of 9—12 minutes for carbon dioxide, 82—103 minutes for propane and 7—22 minutes for 0.73Cj+0.27C3 at the given operating conditions. Hydrate nucleation were carried out at 5°C and 3-5 MPa for carbon dioxide, 2-5°C and 1 MPa for propane and 4°C and 2-4 MPa for 0.73Q+ 0.27C3. In order to calculate the induction time, a semiempirical correlation as a function of supersaturation was used. The equation parameters were determined based on the experimental data via nonlinear regression.
INTRODUCTION
Gas hydrates crystals are non-stoichiometric compounds and consist of polyhedral water cavities that are stabilized by the presence of gaseous components. Three types of structures are known as structure I, II and H [1]. A serious problem in the oil and gas industries is the plugging ofnatural gas transportation lines because ofthe solid nature of hydrates. Natural gas hydrate occurrence is a significant factor to be considered during oil and gas exploration, production and transportation [1].
Some methods have been proposed to prevent the hydrate formation in the gas pipelines. Amongst them is the use of kinetic inhibitors which retards the hydrate nucleation. By this method, induction time is increased to a value higher than the residence time and hydrate is not formed during its passage through the pipeline.
Natarajan et al. [2] used the difference in fugacity of the dissolved gas and the hydrate as the driving force in their hydrate nucleation model. They used fg/feq — 1, as driving force for nucleation where fg is the gas phase iugacityfeq is the equilibrium fugacity at the experimental temperature.
Kyamme [3] proposed a new hydrate formation theory based on the hypothesis that initial hydrate formation takes place at the gas-liquid interface towards the gas side. The theory was modeled and compared to experimental data. Kyamme [4] published a revised version ofthe model where evaluation of cluster distribution and cluster stability analysis were included.
Kashchiev and Firoozabadi [5] analyzed the kinetics ofthe initial stage ofcrystallization of one-component gas hydrates in aqueous solutions. The temporal evolution of the volume of hydrate crystallized and the moles of gas consumed were determined. Expressions were derived for the supersaturation dependence of the hydrate crystallite
growth rate and the induction time in hydrate crystallization. These expressions were used for revealing how additives in the solution that act as kinetic inhibitors ofhydrate crystallization can affect the induction time of the process. The obtained results were applied to crystallization of methane, ethane and cyclopropane hydrates. In this work, the induction time ofhydrate formation ofcarbon dioxide, propane and 0.73Q+ 0.27C3 were studied. Induction time of hydrate formation reaction was measured at operating conditions of 5°C and 3-5 MPa for carbon dioxide, 2-5°C and 1 MPa for propane and 4°C and 2-4 MPa for 0.73Q+ 0.27C3. The parameters of semiempirical correlation developed by Natarajan et al. [2] were optimized as a function of supersaturation to predict the induction time. Driving force or supersaturation of the hydrate formation reaction was calculated based on the work of Anklam and Firoozabadi [6].
THEORETICAL ANALYSIS Induction time is a stochastic property and usually correlated by a semiempirical expression. Natarajan et al. [2] developed the following equation for calculating the induction time as a function of supersaturation:
iind = pc s -1 )m, (1)
where m and P are determined via nonlinear regression based on the measured values of induction times. Supersaturation (S) is equal to exp(Ag/kT) which Ag/kTis calculated based on the work ofAnklam and Firrozabadi [6]. They considered hydrate formation reaction as an aqueous phase reaction where a unit cell of hydrate is formed from different gas molecules by the following reaction
(2)
Zi Gi + Z2 G + ... + zw H2 O—-
— Z1G1 ,Z2 G 2,..., nw H2 O,
where zt is the composition of gas molecules in the hydrate phase, Gt is the gas molecules and nw is the hydra-
INDUCTION TIME OF HYDRATE FORMATION IN A FLOW LOOP
215
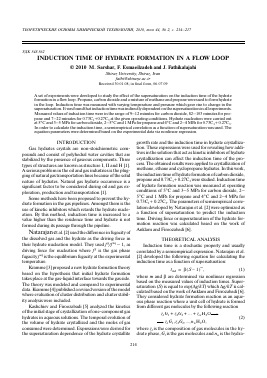
Fig. 1. Experimental flow loop for hydrate formation: DPI — pressure drop sensor, F — flow meter, P1 and P2 — pressure sensors, T1-T3 — temperature sensors, PR — pressure regulator.
tion number. The driving force expression for the above reaction is given by:
Ag = V ^( T,Pe,Ze)kTln[/f( T,P,y)//f( T,Pe,y)J + 11 (3)
+ * w V w ( P - Pe ) - vh ( P - Pe ). In deriving the above equation, it is assumed that hydrate composition is independent of the supersaturation and it is similar to the equilibrium composition. In the above equation, T, Pe and P are the system temperature, equilibrium hydrate pressure and the system pressure, respectively; /f, yi and Zi are gas fugacity, gas composition and the hydrate equilibrium composition, respectively. Natarajan et al. [2] took supersaturation (S) equal to (ffeq), where f is the fugacity at experimental conditions andfeq is the equilibrium fugacity at experimental temperature.
EXPERIMENTAL A flow loop was constructed to study hydrate formation of hydrocarbons and inorganic gases. The flow line was made of 316 ss schedule 80 pipe with an inside diameter of 10.6 mm, and a pressure rating of 10 MPa. The loop layout, shown in figure 1 is 2.0 m wide by 4 m long (four 90-degree elbows) for a total length of 12 m. The materials used for the experiment were fresh water as the aqueous phase and 99.9% propane, 99.9% carbon dioxide
and 0.73C1+0.27C3 as the hydrate formers. Flow loop was filled and its pressure was increased to the operating pressure by injecting water by a piston pump (Pump2, figure 1). Flow loop and inlet water pressures were monitored by local indicators (PI) and (P2), respectively which were shown in figure 1. The precision of the local indicators were 0.01 MPa.
Initial temperature of the flow loop was 16°C which was outside the hydrate formation zone. To move to the formation zone, flow loop temperature was decreased to the experimental temperatures. Temperature reduction was performed gradually by circulating chilled water in 15 and 32 mm polyvinyl chloride (PVC) pipes those encompass the loop. The position of the temperature sensors were shown in figure 1. The PT-100 sensors (T1-T2) were connected to the Atbin digital monitoring system with the precision of 0.4°C. The chiller temperature (T3) was recorded separately and was maintained below 2°C. The fluid flow inside the loop was measured by an Endress-Hauser magnetic flow meter (Type: Promag 30) with the precision of 0.001 m3/hr. The flow meter (F) was shown in figure 1.
Hydrate former was stored in a pressure vessel equipped with a pressure regulator to adjust inlet pressure to the loop. The pressure regulator (PR) was shown in figure 1. Inlet line was a 6 mm external diameter stainless steel pipe (AISI-316) which was jacketed with a 15 mm
TEQPETH^ECKHE QCHQBbI XHMH^ECKQH TEXHQ^QrHH tom 44 № 2 2010
216
SARSHAR et al.
Table 1. Operating conditions of the carbon dioxide hydrate formation
Definition RUN1 RUN2 RUN2
T,°C 5.0 ± 0.4 5.0 ± 0.4 5.0 ± 0.4
P, MPa 3.00 ± 0.01 4.00 ± 0.01 5.00 ± 0.01
F, m3/hr 0.670-0.680 0.670-0.680 0.670-0.680
t, min 30 30 30
^ min 12 10 9
Pe, MPa 2.05 2.05 2.05
Ag/kT 0.304 0.499 0.511
Table 3. Operating conditions of propane hydrate formation
Definition RUN4 RUN5 RUN6
P,MPa 2.0 ± 0.4 3.0 ± 0.4 5.0 ± 0.4
F, m3/hr 1.00 ± 0.01 1.00 ± 0.01 1.00 ± 0.01
t, min 0.735-0.740 0.735-0.740 0.735-0.740
hnfc min 100 100 120
Pe, MPa 82 89 103
Ag/kT 0.260 0.324 0.508
P, MPa 0.607 0.430 0.078
Table 2. Optimized parameters of equation (1)
Definition m ß
Carbon dioxide -0.3879 8.053
Propane -0.0961 82.031
0.73Q+0.27G, -1.6304 90.994
Table 4. Operating conditions of 0.73C1+ 0.27C3 hydrate formation
1.30 1.35 1.40 1.45 1.50 1.55 1.60 1.65 1.70
S
Fig. 2. Comparison of experimental and calculated induction times for carbon dioxide hydrate formation (the average absolute deviation error is 3.19%). Points — experiment; curve — calculation.
polyvinyl chloride (PVC) chilled water pipe to adjust inlet temperature.
Hydrate former was passed through an orifice plate before entering the reactor. The pressure drop across the orifice plate was measured by a Rosemount pressure drop transmitter (Model: 3051). The flow rate was calculated based on the measured values of the pressure drop (DPI) and the structural dimensions of the orifice plate (OR1). The detail ofthe calculations was given elsewhere [7]. The precision of the Rosemount pressure drop transmitter was equal to 0.001 mbar.
RESULTS AND DISCUSSION
Induction times for hydrate formation of carbon dioxide, propane and 0.73C1+0.27C3 were measured in the flow loop. The parameters of equation (1) were deter-
iin^ mm 12.5
12.0
11.5
11.0
10.5
10.0
9.5
9.0
8.5
Definition RUN7 RUN8 RUN9
P, MPa 4.0 ± 0.4 4.0 ± 0.4 4.0 ± 0.4
F, m3/hr 2.00 ± 0.01 3.00 ± 0.01 4.00 ± 0.01
t, min 0.710-0.720 0.710-0.720 0.710-0.720
tind, min 45 45 45
Pe, MPa 22 13 7
Ag/kT 0.527 0.527 0.527
P, MPa 1.20 1.52 1.72
mined by nonlinear regression based on the prediction of experimental data.
Carb
Для дальнейшего прочтения статьи необходимо приобрести полный текст. Статьи высылаются в формате PDF на указанную при оплате почту. Время доставки составляет менее 10 минут. Стоимость одной статьи — 150 рублей.