ЯДЕРНАЯ ФИЗИКА, 2012, том 75, № 6, с. 782-784
ЭЛЕМЕНТАРНЫЕ ЧАСТИЦЫ И ПОЛЯ
INHOMOGENEOUS CHIRAL SYMMETRY BREAKING PHASES
© 2012 M. Buballa1)*, S. Carignano1)**, D. Nickel2)***
Received March 31, 2011
We investigate inhomogeneous chiral symmetry breaking phases in the phase diagram of the two-flavor Nambu—Jona-Lasinio model, concentrating on phases with one-dimensional modulations. It is found that the first-order transition line in the phase diagram of homogeneous phases gets completely covered by an inhomogeneous phase which is bordered by second-order transition lines. The inhomogeneous phase turns out to be remarkably stable when vector interactions are included.
1. INTRODUCTION
A better understanding of the phase diagram of quantum chromodynamics still poses one of the biggest challenges in modern nuclear physics [1]. In the most common picture, chiral symmetry, which is spontaneously broken in vacuum, gets restored at low temperature and high chemical potential in a firstorder phase transition, whereas at high temperature and low chemical potential there is only a rapid crossover. As a consequence, the first-order phase boundary ends at a critical point (CP), which is presently the focus of intensive experimental and theoretical efforts. While the existence of a crossover at zero chemical potential has been confirmed by ab-initio lattice gauge calculations [2], the other features of the above picture are so far mainly based on model calculations. In this context a pioneering role was played by the Nambu—Jona-Lasinio (NJL) model [3], within which the critical endpoint was predicted already in 1989 [4]. Similar results have also been obtained in the quark—meson model [5, 6].
However, in most of these investigations it was tacitly assumed that the chiral condensate, i.e. the order parameter of chiral symmetry breaking is homogeneous in space. On the other hand, the importance of chiral crystalline phases being characterized by an inhomogeneous order parameter has been pointed out long ago. Well-known examples are the Skyrme crystal [7] and the chiral density wave [8]. Recently, they have also been discussed in the context of quarkyonic matter [9]. In these proceedings, we briefly
''Institut für Kernphysik, Technische Universitat Darmstadt, Germany.
2)Institute for Nuclear Theory, University of Washington, Seattle, USA.
E-mail: michael.buballa@physik.tu-darmstadt.de E-mail: carignano@crunch.ikp.physik.tu-darmstadt. de
E-mail: mdjn@u.washington.edu
discuss some results of [10—12], where phases with one-dimensional modulations of the chiral condensate have been investigated in the NJL model. It is shown that the consideration of inhomogeneous phases changes the phase diagram drastically. In particular, the critical endpoint disappears.
2. MODEL The Lagrangian of our model is given by
L = dß - m) ф + (1)
+ Gs ({фф)2 + (фMj5raф)2) - Су (ф^ф)2 ,
where p is a 4Nf Nc-dimensional quark spinor for Nf = 2 flavors and Nc = 3 colors, y^ and ta are Dirac and Pauli matrices, respectively, m is the degenerate current quark mass, and GS and GV are dimension-ful coupling constants. In mean-field approximation we linearize the interaction terms around the expectation values S(x) = (tp(x)tp(x)) (scalar condensate), P3(x) = (tp(x)ij5t3tp(x)) (pseudo-scalar condensate), and n(x) = (tpJf(x)p(x)) (density), which we allow to be spatially dependent. In the case of a periodic condensate with Wigner—Seitz cell V and using the imaginary-time formalism, the mean-field thermodynamic potential per volume is then given by
T
(2)
X In (iun + H — ¡l) j + 1 f /|M(x)-m|2 (/j(x)-/x)2
V J y 4GV
with the spatially dependent "constituent quark" mass M(x) = m - 2GS(S(x) + iP(x)), the renor-malized quark chemical potential jl(x) = fx —
n
INHOMOGENEOUS CHIRAL SYMMETRY
783
T, MeV 100
80 60 40 20
0 100 80 60 40 20 0
300 350 400 450 500
300 350 400 450 500
MeV
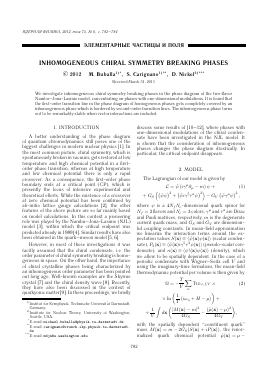
The phase diagram in the chiral limit for different values of the vector coupling constant Gv. The dashed lines represent the second-order transition lines joining at the Lifshitz point (dot), the shaded region represents the inhomogeneous phase. The solid lines represent the first-order phase transition obtained when limiting to homogeneous order parameters, which turns to second order (dash-dotted lines) at the critical point (square). (From [12].)
—2GVn(x), and the quasi-particle Hamiltonian
Y 0
H-n = -i^fdi + ^ (M(x) + M(x)* + (3) + y5t3M(x) — y5t3M(x)*) - ¡l(x).
The functional trace in Eq. (2) acts on Dirac, color, flavor, and coordinate space, and the sum is over fermionic Matsubara frequencies un = (2n + 1)nT.
At fixed temperature and chemical potential, the ground state is given by the minimum of Q with respect to the various mean fields. For general spatially dependent mean fields this corresponds to a highly nontrivial variational problem. However, as shown in [10], for GV = 0 one can exploit the analytically known solutions [13—15] of the 1 + 1-dimensional Gross—Neveu model to construct stationary solutions of the 3 + 1-dimensional NJL model with one-dimensional mass modulations. These solutions can be generalized to the case Gv > 0 if the density n(x) is approximated by its spatial average (n(x)) = = const. As a consequence, l = ¡i — 2GVn becomes constant as well, and the problem reduces to the case GV = 0 at a shifted value of the chemical potential. For further details, see [12].
3. PHASE DIAGRAM
In the following we restrict ourselves to the chiral limit (m = 0) and fix the model parameters by requiring for the pion decay constant fn = 88 MeV and for the constituent mass in the vacuum M0 = 300 MeV.
The value of the vector coupling GV is treated as a free parameter, which will be varied in order to study its effect on the phase diagram.
In the figure we present the resulting ¡—T phase diagrams, focusing on the region where the inhomo-geneous phase is preferred [12]. For comparison we have also indicated the transition lines one obtains when the analysis is limited to homogeneous phases. In this case there is a CP for small values of GV (square) below which the transition from the broken to the restored phase is first order (solid line). Upon increasing GV the CP is shifted to smaller temperatures (and higher chemical potentials) and eventually hits the zero temperature axis, so that the first-order phase transition is absent for larger values of GV. This behavior is well known and has recently attracted new interest in the discussion of the critical surface.
However, the picture changes considerably, when we allow for inhomogeneous solutions. We then always find a regime where the domain-wall solitons are preferred (shaded region), so that we can distinguish three different phases: the homogeneous chirally broken phase, the restored phase and the in-homogeneous phase. The corresponding three phase boundaries are all of second order. Their conjunction defines a so-called Lifshitz point (dot), above which the phase boundary coincides with that found when limiting to homogeneous phases. Moreover, for GV = = 0 the Lifshitz point precisely agrees with the CP of the purely homogeneous analysis [10]. This can be understood analytically within a Ginzburg—Landau analysis [11].
ftOEPHAfl OH3HKA tom 75 № 6 2012
784
BUBALLA et al.
It turns out, however, that this is no longer true for GV > 0: Whereas with increasing vector coupling the CP moves downwards in temperature and eventually disappears from the phase diagram, we observe that the Lifshitz point is only shifted in the ¡ direction, while remaining at the same temperature. Consequently, unlike the first-order boundary in the purely homogeneous case, the existence of the inhomogeneous phase is not inhibited by the vector interaction. At vanishing temperature the transition from the homogeneous broken to the inhomogeneous phase is only slightly varying with GV, whereas the transition from the inhomogeneous to the restored phase significantly shifts, thus enhancing the domain where inhomogeneous phases are favored. As discussed in [12], it can be shown that in the jf—T plane the inhomogeneous region is independent of GV. The GV dependence observed in figure is thus simply a result of the mapping j ^ j = f + 2GV (n).
Our results show that for GV > 0 the CP has disappeared from the phase diagram. Even if CP present in a purely homogeneous analysis, it is covered by the inhomogeneous phase, when the latter is taken into account. An important consequence is that the quark number susceptibility, which diverges at the CP, remains finite in the entire phase diagram.
The results presented here should be considered as first steps towards a more complete picture of the phase diagram with inhomogeneous phases. In particular, we should relax the restriction to inhomogeneities with one-dimensional modulations and study higher-dimensional modulations as well. Although technically much more demanding, this should be possible in a more numerical approach as outlined in [16] in the context of inhomoge-neous color-superconducting phases. Eventually, one would like to study the transition from a single
nucleon to nuclear matter and finally to color-superconducting quark matter.
This work was partially supported by the DOE under grants nos. DE-FG02-00ER41132 and DE-FG0205ER41360, by the DFG under grant no. Ni 1191/1-1, by the Helmholtz research school H-QM, and by EMMI.
REFERENCES
1. K. Fukushima and T. Hatsuda, Rep. Prog. Phys. 74, 014001 (2011).
2. Y. Aoki, G. Endrodi, Z. Fodor, et at., Nature 443, 675 (2006).
3. Y. Nambu and G. Jona-Lasinio, Phys. Rev. 122, 345 (1961); 124,246(1961).
4. M. Asakawa and K. Yazaki, Nucl. Phys. A 504, 668 (1989).
5. O. Scavenius, A. Mocsy, I. N. Mishustin, and D. H. Rischke, Phys. Rev. C 64, 045202 (2001).
6. B.-J. Schaefer and J. Wambach, Nucl. Phys. A 757, 479 (2005).
7. A. S. Goldhaberand N. S. Manton, Phys. Lett. B 198, 231 (1987).
8. W. Broniowski, A. Kotlorz, and M.
Для дальнейшего прочтения статьи необходимо приобрести полный текст. Статьи высылаются в формате PDF на указанную при оплате почту. Время доставки составляет менее 10 минут. Стоимость одной статьи — 150 рублей.