ТЕОРЕТИЧЕСКИЕ ОСНОВЫ ХИМИЧЕСКОЙ ТЕХНОЛОГИИ, 2011, том 45, № 6, с. 628-633
УДК 66.021.3
INTERFACIAL AREA AND MASS TRANSFER COEFFICIENTS IN LIQUID-GAS EJECTORS © 2011 A. Arunagiri, I. Regupathi*, T. Murugesan**
National Institute of Technology, Trichy, India *National Institute of Technology, Mangalore Karnataka, India. **Universiti Teknologi PETRONAS, Bandar Seri Iskandar, Tronoh, Perak, Malaysia
murugesan@petronas.com.my Received 10.08.2010
Measurements and correlations are reported for the interfacial area and mass transfer coefficients as a function of energy dissipation in a liquid—gas ejector. The correlations for interfacial area and mass transfer coefficients have been developed using Kolmogorov's theory and Levich's hydrodynamic derivations. The present developed correlations are validated using experimental results.
INTRODUCTION
EXPERIMENTS
The production/absorption rate of gas—liquid systems is often controlled by gas—liquid interfacial mass transfer. Particularly for the removal of acid gases from natural gas, packed columns have been used traditionally. Since acid gases undergo chemical absorption with amine solutions (absorbents), large number of stages is no more required for attaining equilibrium. Simultaneous aspiration and dispersion of the entrained fluid takes place in the cocurrent gas—liquid ejector systems, which causes continuous formation of fresh interface and hence the generation of large interfacial area [1]. Very small bubbles/droplets of the dispersed phase were produced in the liquid—gas ejectors, thereby increasing the contact between the phases, which in turn enhances the mass transfer rates. The higher efficiency of ejectors for gas dispersion is due to the micro turbulence which causes the bubble break up [2]. It was also reported that the mass transfer coefficient in high intensity gas—liquid mixers is two orders of magnitude higher than in conventional gas—liquid contactors. Higher values of interfacial area and mass transfer coefficients lead to a substantial reduction in the size of the contacting equipment, thereby reducing the capital investment cost of the equipment. The important design and the scale-up parameters for such type of contactors are the interfacial area for mass transfer and the true mass transfer coefficients apart from the phase holdup. Even though there have been a number ofpublications [3—11] on liquid jet gas ejectors, none of them provides detailed information, that is required for the design and scale-up. A detailed literature review pertaining to the hydrodynamics of the liquid—gas ejector is presented in our earlier paper [12]. Hence in the present work, an attempt is made to develop a theoretical expression from the first principles, to represent the interfacial area and mass transfer coefficients data for liquid—gas ejectors.
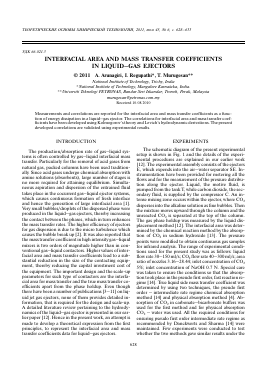
The schematic diagram of the present experimental setup is shown in Fig. 1 and the details of the experimental procedures are explained in our earlier work [12]. The experimental assembly consists of the ejectors E, which expends into the air—water separator SE. Instrumentation have been provided for metering all the flows and for the measurement of the pressure distribution along the ejector. Liquid, the motive fluid, is pumped from the tank T, while carbon dioxide, the secondary fluid, is supplied by the compressor C. An intense mixing zone occurs within the ejector, where CO2 disperses into the alkaline solution as fine bubbles. Then the mixture moves upward through the column and the unreacted CO2 is separated at the top of the column. The gas phase holdup was measured by the liquid displacement method [12]. The interfacial area was determined by the chemical reaction method by the absorption of CO2 in sodium hydroxide [13]. The pressure points were modified to obtain continuous gas samples for infrared analysis. The range of experimental conditions used for the present study was as follows: liquid flow rate 30-150 ml/s; CO2 flow rate 40-300 ml/s; area ratio of nozzles 3.16-28.44; inlet concentration of CO2 5%; inlet concentration of NaOH 0.7 N. Special care was taken to ensure the conditions so that the absorption took place in the pseudo first order, fast reaction regime [14]. True liquid side mass transfer coefficient was determined by using two techniques, the pseudo first order - intermediate rate regime chemical absorption method [14] and physical absorption method [4]. Absorption of CO2 in carbonate-bicarbonate buffers was used for the first method and for physical absorption CO2 - water was used. All the required conditions for ensuring pseudo first order intermediate rate regime as recommended by Danckwerts and Sharma [14] were maintained. Few experiments were conducted to test whether the two methods gave similar results under the
Vent Separator
¥
Valve
Sampling Point
Sample Gas Filter
Recorder Inta-Red Gas Analyser
Rotameter Surge Tank
CO2 Cylinder
Valve Packed Mixer
! Ejector
I I I I
Valve X 0_
Sampling Point
A Valve
'—»- Dr
K) .
Drain Sampling Point
Й
-X-
Valve
Compressor
mP=ess°d
Valve -IX—
Oil Trap
O
Sampling Point
Thermometer
Surge Tank
i
—(2)Pressure Gauge C) Sampling Point
Rotameter
Valve -X—
-X-
■QPump
Valve
Tank
Drain
Fig. 1. Experimental setup.
identical hydrodynamic conditions and a satisfactory agreement was found. In the present experiments, the values for the specific interfacial area a were obtained in the range of 3 x 10²-44 x 102 m-1, whereas for the volumetric coefficient kla ranged from 2 x 10⁻⁴ to 15 x x 10-4 m/s.
DEVELOPMENT OF CORRELATION FOR INTERFACIAL AREA
The variation of the interfacial area with the primary fluid flow rate is shown in Fig. 2. Similar results were obtained with all the other nozzles tested. The interfacial area and mass transfer coefficient are the important parameters for the design of gas-liquid contacting equipment and have been extensively studied for various configurations [15]. It has been generally recognized that the dominant parameter affecting the interfacial area and mass transfer coefficients in gas-liquid systems is the specific energy input to the system. Various authors [3-11] have attempted to use some form of the pressure drop as a measure of the energy dissipation and to correlate the pressure drop with the interfacial area and liquid side mass transfer coefficient. In the liquidgas ejector systems, the interfacial area and the mass
transfer coefficients are intimately connected with the structure of the turbulence. Therefore, it should be possible to relate these parameters with the characteristics of turbulence, viz., its scale and intensity, through Kol-mogorov's theory [16] and Levich's hydrodynamic de-
Fig. 2. "Variation of the specific interfacial area with liquid and gas flow rates (nozzle 3, AR = 10.31): Q1 = (1) 40 x 10-6, (2) 120 x 10-6, (3) 255 x 10-6, and (4) 310 x 10-6 m3/s.
viations [17]. If a bubble is placed in turbulent fluid, it breaks up under the action of turbulent eddies. This fragmentation process takes place when the dynamic pressure force exceeds the capillary force holding the bubble together. The difference in dynamic pressure between the opposite sides of a gas bubble is given by [17]
AP = kf jp
2 2 u1a U1b
2 '
(1)
e = a
3
Piv 1 X '
(2)
V3
(5)
(6) 2 V
The characteristic bubble dimension in the direction of motion is given by
h =
2ст
2
PiUj
(7)
8na
Kf2P2PlU16
(8)
with F = nd 3/6,
(d )
V / max
V Kf 2 У
1/3
y/3
Pi 1 -
vP2 J Pi«i
In a turbulent field, the breakup of a bubble of diameter greater than d will be caused by turbulent eddies of scale X = dB. Therefore, the eddy velocity of interest vx can be obtained from Equation (3) with X = d or
For large eddies, the change in velocity over a bubble will be small, the bubble fragmentation is essentially caused by small eddies. According to Kolmogorov's theory of spectral energy transfer [16], energy is extracted from large eddies and cascades down the spectrum to the small eddies till finally lost as heat. Further, it has been postulated that at sufficiently high Reynolds numbers, there is a range ofwave numbers where turbulence is statistically in equilibrium. Under such conditions, the only parameters affecting the energy transfer are the density, eddy velocity and eddy scale. By dimensional similarity,
=
P )
1/3
(10)
In Equation (9), the interphase velocity u1 is the eddy velocity as given in Equation (10). Substituting this expression in Equation (9), we get an expression for the maximum bubble size as
d max
( с V/3 6
V Kf 2 J
Pi f (2 YafeV2/3 Pi
VP2 ) VPl which may further be simplified as
, 0.6 -0.4 -0.2
dB = Ola s P2 .
(11)
(12)
-0.2
- 'HPJ • (3)
As a first approximation, the eddy velocity v can be taken as the velocity difference over the eddy scale X, or
v2 = ula - %• (4)
Therefore, the dynamic pressure, Equation (1) becomes
P = KfiPi f eX^223
2 Ipi J
According to Levich [17], the drag force acting on a gas bubble sets the gas inside in motion and creates a dynamic pressure proportional to p2u^/2, within the bubble, acting radially outwards. If the dynamic pressure exceeds the capillary forces, the bubble will break. Therefore the condition for the bubble fragmentation is
Kf 2p2U2 > CTnh2
The proportionality of bubble diameter to p- " is in good agreement with the observations of Cramers et al. [1]. The interfacial area and gas holdup are related to the bubble diameter and the number of bubbles in the system by the equation
A = Nd2, (13)
Therefore,
a 2VR = Nd3
a = A = a 2
(14)
(15)
Vr dB
Substituting for bubble diameter in Equation (12), we get
r, 0.4 C26 a 2.
(16)
Equation (16) is well applicable to low gas concentrations where the turbulence is created by the liquid phase alone. Where the gas holdup is high, Calderbank [18] proposed a correction factor to the exponent of the gas holdup to take into account the turbulence created by the gas phase.
Для дальнейшего прочтения статьи необходимо приобрести полный текст. Статьи высылаются в формате PDF на указанную при оплате почту. Время доставки составляет менее 10 минут. Стоимость одной статьи — 150 рублей.