ФИЗИКА ПЛАЗМЫ, 2013, том 39, № 12, с. 1115-1121
ЛАЗЕРНАЯ ПЛАЗМА
УДК 533.9
LASER INDUCED BREAKDOWN SPECTROSCOPIC STUDY OF AMMONIUM NITRATE PLASMA © 2013 г. M. Hanif*, M. Salik**, M. A. Baig***
* MCS(National University of Sciences &Technology), Rawalpindi, Pakistan, ** Institute of Optoelectronics, Beijing Jiaotong University, Beijing, China *** NationalCenterfor Physics, Quaid-E-Azam University Campus, Islamabad, Pakistan
e-mail: drhanif-mcs@nust.edu.pk Поступила в редакцию 27.03.2013 г. Окончательный вариант получен 01.07.2013 г.
We present the optical emission studies of the Ammonium nitrate plasma produced by the fundamental (1064 nm) and second (532 nm) harmonics of a Q-switched Nd: YAG laser. The target material was placed in front of the laser beam in an open air atmospheric. The spectrum reveals numerous transitions of neutral nitrogen. We have studied the spatial behaviour of the plasma temperature (Te) and electron number density (Ne) determined using the Boltzmann plot method and Stark broadened line profiles respectively. Besides, we have studied the variation of the plasma parameters as a function of the laser irradiance.
DOI: 10.7868/S0367292113120056
1. INTRODUCTION
The technique employed in this study is Laser-induced breakdown spectroscopy (LIBS), has developed rapidly as an analytical technique over the past couple of decades [1]. It employs a high-energy pulsed laser (typically tens to hundreds of mJ per pulse) and a focusing lens, to generate plasma on the surface of the target [2]. The spectrum of the plasma plume is the signature of the chemical species in the sample and its analysis yields their composition and relative abundance [3]. The laser-produced plasma characteristics depend on several parameters including target features (physical and chemical properties), ambient medium properties (chemical composition and pressure), and laser pulse properties (pulse width, wavelength, spot size, and laser energy) [4]. LIBS technique is unique that can be used to chemically analyze rocks, glasses, metals, sand, teeth, bones, powders, hazardous materials, liquids, plant, biological material, polymers, and ceramics etc. [5].
Ammonium nitrate is a chemical compound with the formula NH4NO3; composed of nitric acid and a salt of ammonia. At room temperature, it appears in a white crystalline form. It is an important element having numerous applications; in the fertilizer products, as an oxidizer in explosives and solid propellants as it is also found in atmospheric aerosols. The thermal decompositions of ammonium nitrate have also been extensively studied due its applications as an energetic material. The ammonium nitrate remained under extensive investigations using LIBS and other elemental analysis techniques. S. Vyazovkin et al [6] studied the kinetics of the thermal dissociation of solid and liquid ammonium nitrate. L. Pasternack and J. K. Rice [7]
carried out the laser ablation of ammonium nitrate. S. Sunku et al [8] presented results on the stoichiometric analysis of ammonium nitrate and ammonium perchlorate using LIBS technique. D. Diaz et al [9] also used the LIBS technique for the detection of ammonium nitrate in soils. R.Wood et al [10] presented the experimental profiles of the 120 nm resonance triplet of atomic nitrogen for a variety of operating conditions of an electrodeless lamp, and the corresponding absorption curves were calculated. M. Ha-nafi et al [11] studied the spectral emission of helium, argon, nitrogen and air irradiated with ruby laser radiation at a wavelength of 694.3 nm and a pulse width of 40 ns using LIBS technique. C.J. Damm et al [12] used excimer laser fragmentation-fluorescence spec-troscopy as a method for monitoring ammonium nitrate and ammonium sulfate particles. Yi-Kang Pu et al [13] used emission spectroscopy to investigate the effect of inert gas mixing with nitrogen plasmas generated in inductively coupled plasma and electron cyclotron resonance plasma sources. Y. S. Mok et al [14] investigated non-thermal plasma process combined with monolithic V2O5/TiO2 catalyst for the removal of nitrogen oxides. N. W. Zheng and T. Wang [15] presented theoretical resonance transition probabilities and lifetimes for atomic nitrogen. S. Sunku et al [16] described their results obtained from stoichiometric ratio studies of ammonium perchlorate, boron potassium nitrate, and ammonium nitrate using LIBS technique with nanosecond pulses.
In the present work, we report the spectroscopic studies of the plasma generated at the surface of ammonium nitrate using fundamental (1064 nm) and second (532 nm) harmonics of a Q-switched Nd: YAG
Counts 1000 001
800 600 400 200 0
0.3 mm i_i
(b)
10 keV
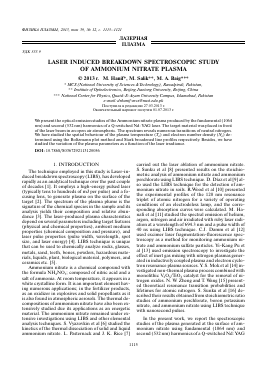
Fig. 1. a) — SEM Photograph of the sample target (AN) showing its morphology; b) — the SEM signals of the sample target.
laser. We have studied the transitions at 493.51, 551.81, 599.94, 610.33, 613.37, 648.48, 649.95, 652.11, 659.58, 666.69 and 670.04 nm of neutral nitrogen to study the spatial behavior by estimating the electron temperature (Te) and the electron number density Ne).
2. EXPERIMENTAL DETAILS 2.1. The sample
In this experiment the sample studied is Ammonium Nitrate (AN) containing mass percentage of 24.79% of nitrogen and 75.21% of oxygen. A small amount of the sample was used to prepare a pellet of 15 mm diameter and 3 mm thickness with the help of hydraulic press machine using a load of 10-Ton, for a time duration of 5 minutes. The electron microscope (SEM) photograph of the Ammonium Nitrate sample and the quantitative analysis of the sample conducted by JSM-6490A analytical SEM are shown in Fig. 1a and Fig. 1 b.
2.2. Experimental setup
The experimental setup is shown in Fig. 2 and is same as that described in our previous work [17—22]. Briefly we used a Q-switched Nd: YAG (Quantel Brilliant) pulsed laser having pulse duration of 5 ns and 10 Hz repetition rate which is capable of delivering 400 mJ at 1064 nm, and 200 mJ at 532 nm. The laser pulse energy was varied by the flash lamp Q-switch delay through the laser controller, and the pulse energy was measured by a Joule meter (Nova — Quantel 01507). The laser beam was focused on the target using convex lens of 20 cm focal length. The sample was mounted on a three dimensional sample stage, which was rotated to avoid the non-uniform pitting of the target. The distance between the focusing lens and the sample was kept at 18.5 cm, less than the focal length of the lens to prevent any breakdown of the ambient air in front of the target. The spectra were obtained by averaging 10 data of single shot under identical experimental conditions. The radiation emitted by the plasma were collected by a fiber optics (high-OH, core diameter: 600 ^m) having a collimating lens (0—45° field of view) placed at right angle to the direction of the laser beam. The optical fiber was connected with the LIBS-2000 detection system (Ocean Optics Inc.), to measure the plasma emission. The emission signal was corrected by subtracting the dark signal of the detector through the LIBS software. The LIBS-2000 detection system is equipped with five spectrometers each having slit width of 5 ^m, covering the range between 220 to 720 nm. Each spectrometer has 2048 element linear CCD array and an optical resolution of ~0.05 nm by scanning a narrow bandwidth dye laser. In the experiments, the time delay between the laser pulses and the start of the data acquisition is about 3.5 ^s, whereas the system integration time is about 2.1 ms and stored by the OOI LIBS software. In order to record the emission spectrum, the LIBS-2000 detection system was synchronized with the Q-switch of the Nd: YAG laser. The flash lamp out of the laser triggered detection system through a four-channel digital delay/Pulse generator (SRS DG 535). The data acquired simultaneously by all the five spectrometers
were stored on a PC through the OOILIBS software for subsequent analysis.
3. RESULTS AND DISCUSSIONS
3.1. Emission studies
In the first set of the experiments, we have recorded the ammonium nitrate plasma emission generated by the fundamental (1064 nm) and second (532 nm) wavelengths of the Nd: YAG laser. The laser was focused by a quartz lens with a focal length of 20 cm. Ammonium nitrate plasma was recorded at different positions along the direction of propagation of the plasma. Fig. 3a shows a small portion of the emission spectrum covering the spectral region from 550 nm to 675 nm. This part of the spectrum predominantly shows the spectral lines of neutral nitrogen N(I). The emission spectral lines at 493.51 corresponds to 4p 2S1/2 ^ 3s 2P3/2 transition, 551.81 to 5d 4D5/2 ^ 3p 4D3/2, 599.94 to 4d 2P1/2 2D3/2 ^ 3s 4P1/2, 613.37 to 3s 2D to 4d 4F7/2 ^ 3p 4D 652.11 to 4d 4F
5/2
^ 3p 2S1/2, 610.33 to 3s 5/2 ^ 3s 4P5/2, 648.48 5/2, 649.95 to 4d 4F5/2 ^ 3p 4D5A ^ 3p 4D7/2, 659.58 to 5d 2D3/2 ^ 3p
2P1/2, 666.69 5d 2P3/2 ^ 3p 2P3/2 and 670.04 nm to 5d
2P3/2 ^ 3p 4P1/2 respectively and their transitions are
1/2
shown in Fig. 3b based on line identification given in the NIST data base [24].
3.2. Determination of electron temperature
Having observed the well-resolved multiplet structure from a number of excited levels and decaying to a common lower level, it is alluring to extract the plasma parameters from the observed spectra; in particular, the electron number density and the electron temperature. The electron temperature (Te) is determined using the Boltzmann plot method from the relative intensities of the observed line. The intensities of the emission lines are normally proportional to the population of the pertinent upper levels. The following relation has been used to extract the plasma temperature [2]:
ln
fki^ ki AkiSk.
= ln
rN (T ) ^ U (T )
kT
(1)
where, Iki is the integrated line intensity of the transition involving an upper level (k) and a lower level (i), Xki is the transition wavelength, Aki is the transition probability, gk is the statisti
Для дальнейшего прочтения статьи необходимо приобрести полный текст. Статьи высылаются в формате PDF на указанную при оплате почту. Время доставки составляет менее 10 минут. Стоимость одной статьи — 150 рублей.