ПРИМЕНЕНИЕ ВЫЧИСЛИТЕЛЬНОЙ ^^^^^^^^ ТЕХНИКИ В ЭКСПЕРИМЕНТЕ
MOTION DETECTION IN CT IMAGES WITH A NOVEL FAST TECHNIQUE
© 2013 Z. Islami rad*, **, R. Gholipour Peyvandi*, R. Heshmati*
*Nuclear Science and Technology Research Institute AEOI, P.O. Box: 14155-1339, Tehran, Iran **Nuclear Engineering and Physics Department, Amir Kabir University P.O.Box: 15875-4413, Tehran-Iran Received December 28, 2011; in final form, July 28, 2012
Different factors may influence the image quality of the first generation computed tomography (CT) system (single-source — single-detector) and one of these factors is the object motion. For studying this effect on image quality, an industrial CT system was designed and developed. Several experiments were performed with different axial and rotational motion of a phantom. The quality of reconstructed images was compared by computing the RMSE of each image. Also, in this paper a processing technique is presented that has the potential to detect the object motion during the acquisition process and to correct it by rescanning from motion point. The presented results can be extended to other medical and industrial applications.
DOI: 10.7868/S0032816213030063
1. INTRODUCTION
Patient motion during the data acquisition process results in an inconsistent set of projection data and a degradation of image quality due to motion artifacts. These artifacts appear in the form of distortions and blurring which may result in inaccurate or misleading diagnoses [1—3]. Different methods have been proposed for detecting and correcting for motion during clinical imaging. Sarkar et al. proposed a method in which patient motions are estimated and compensated using a correlation function based on linograms and sinograms of the projection data [4]. Eisner et al. presented motion identification and correction method based on cross-correlation of summed horizontal and vertical profiles of successive projections [5]. Linney and Gregson extended a method in which one can detect and correct organ motion by using opposite rays in fan-beam projection in CT scanner [6].
In references [7—9], the adaptive interference canceller (AIC) approach is used to remove the motion artifacts identified by the spatial overlap correlator. Another technique is based upon a property of the Radon transform, which states that for a given object the integral of projection data is constant for all projection angles. If the object starts deforming during a CT data acquisition process due to organ motion, this integral will not remain constant over time. Using this property, the phases of periodic in cardiac motion can be identified [10, 11].
In this article, we intended to study the effect of axial and rotational phantom motion on obtained sino-
gram and reconstructed image quality using the RMSE quantity and then proposed a method to detect
real time motion and correct artifacts due to phantom motion by repeating the imaging process from motion point. The accuracy of this method is verified using simulated phantom and experimental data.
J r\J +1
50 View
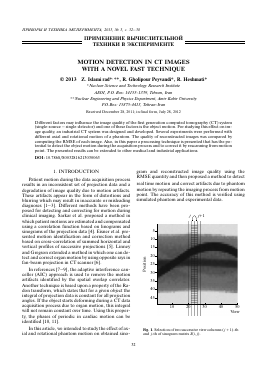
Fig. 1. Selection of two successive view columns (j + 1)-th and j-th of sinogram matrix S(i, j).
Fig. 2. Phantom displacement for studying of: (a) axial dislocation; (b) rotational dislocation.
2. THEORY
Here, we investigate the effect of axial and rotational motion of phantom on quality of CT images that causes artifacts, which appear as blurring, doubling or streaking, which may lead to an erroneous diagnosis; therefore we proposed a technique to detect phantom motion. The main idea of this technique is to evaluate the continuity of sinogram by subtracting the projection data recorded at two adjacent views. In case of no motion, the results of this subtraction process would be almost zero whereas a nonzero value indicates the presence of motion, so by checking the standard deviation of the difference of sinograms one can observe phantom displacement.
2.1. Radon Transform
Tomography imaging consists of directing y-rays into an object from multiple orientations and measuring intensity decrease along a series of linear paths. The intensity reduction is characterized by Beer's law, which describes it as a function of y-ray energy, path length, and linear attenuation coefficient of material [12].
The Radon transform computes projections of an image. The Radon transform can be defined as the collection of projections of an object gathered at various angles. In a y-ray transmission, the intensity I of a monoenergetic radiation beam traversing a phantom is given by the following equation:
g =
= ln(/0/I) = x,y)du.
(1)
fined as the logarithm of the ratio of the intensity of the detected beam to the intensity of the emitted beam and L is the line along which the beam travels.
The line L can be represented uniquely by the parameters p and 9, where 9 measures the counterclockwise angle of the line from the vertical, and p measures the distance of the line from the origin of the (x, y) plane. Thus, we can use the above formula to define a transform which maps a function ^(x, y) to a function g(p, 9), where g(p, 9) is the line integral of ^(x, y) over the line defined by p and 9. This transform is known as the Radon transform and denoted by R so the Radon transform of ^(x, y) at the angle 9 is the line integral of ^ parallel to the y axis:
Rp(x') =
J ^(x' cos 9 - y sin 9, x' sin 9 + y cos 9)dy';
x' cos 9 sin 9 x
_ y'_ - sin 9 cos 9 _ y
Where I0 is the incident beam intensity of the radiation beam; du is some differential path length; ^(x, y) is the function describing the two-dimensional distribution of attenuation coefficient in the imaged object at the point (x, y); g, the transmittance of the object, is de-
(2)
(3)
The function R^(x') is often referred to as a sinogram because the Radon transform of an off-center point source is a sinusoid and all of the points composing the sample produce a so called sinogram matrix.
Finally, acquired sinograms should be reconstructed to find ^(x, y) given knowledge of R^(x'), therefore the Filter Back Projection algorithm is used to reconstruct from the measured projections by the filtered back projection method to bring about the inverse Radon transformation. The FBP algorithm begins by filtering the Radon transform data. There are many filters which can be used in our experiments; we used the Ramachandran & Lakshminarayanan (Ram-Lak) filter to remove some of the high-frequency components that are often fraught with noise [13—15].
L
Fig. 3. Left-to-right — STD-errors, sinogram and reconstructed image with changes of (a) axial and (b) rotational in Shepp-Lo-gan phantom.
2.2. Detection of artifacts due to motion in sinogram
For real-time detection of errors due to phantom motion a program was written for extracting the sinogram from the acquired data.
Sinogram is a sinusoidal continuous function. We assume that the variation of sinogram with respect to the view angle is less than the data noise, therefore any deviation from normal distribution of sinogram is considered as a discontinuity which represents the error due to phantom motion as shown below:
ES(i,j) = ¿(i,j +1) - ¿M, i = 1,..., n; j = 1,..., m -1.
(4)
Here ES(i, j) is the difference between two successive view columns (j + 1)-th and j-th in sinogram matrix S(i, j) (Fig. 1). The standard deviations (STD) of measured errors are calculated by the following equation
D(j ) =
n
1 ^ [ES (i, j )]2
(5)
i = 1
D(j), dislocation parameter represents error due to phantom motion which by drawing standard deviation of errors, any phantom motion can be detected.
It should be noted that the number of AG and Ar are views (m) and positions (n) respectively, thus positions x x views (n x m) are called projections [16].
2.3. RMSE
For quantification of the acquired results from experiment and comparing of the effect of phantom dislocation is used the root mean square error that the mathematical formulation is:
RMSE
=
N
£(n^i -Mi)2
i = 1
N2
(6)
Where ^true, i and ^recon, i are true and reconstructed attenuation mean values at pixel i and N is the total number of pixels [17].
The procedure described can be used for relative comparison of reconstructions of the same object.
3. EXPERIMENTAL SET-UP
A single-source — single-detector gamma computed tomography (CT) scanner system was used in this study. In this system a NaI(Tl) detector 50.8 mm in diameter was located opposite to the center of the 137Cs
Dislocation Parameter
(a)
40 r
35 30
25
Without displacement
10 20 30 40 50 60 70 80
800 700 600 500 400 300 200 100
10 20H 30 405060 70-80-_
50 40 -30
-20
■—20 m—30 H—40
Dislocation Parameter
2 mm
(b)
50
S3 40 ^ 30
20
10 20 30 40 50 60 70 80
800 700 600 500 -400 300 200 100
1-1-1-r
10-I 20 304050 60H 70 80^
-50 -40 30 20 10 0 -10 -20 -30 -40
Dislocation Parameter
4 mm
(c)
80 r
60
£
% 40
20
10 20 30 40 50 60 70 80
800 700 600 500 400 300 200 100
n-1-1-r
I-
10203040 50H 60 70-1 80
-50 40 30 h20 10 -0 — 10
Dislocation Parameter
10 mm
(d)
150
100
£
% 50
10 20 30 40 50 60 70 80
800 700 600 500 400 300 200 100
10 20 30 40 50 60 70 80
-50 -40 -30 -20 10 0
Dislocation Parameter
20 mm
(e)
300 r
200
i % 100
20 40 View
60
10 20 30 40 50 60 70 80
800 700 600 500 400 300 200 100
10 20 30 40 50
10
20 30H 40 50-1 60 7080-
20 40 60 80
1-50 40 1-30 20 10 0 -10 -20 -30
Fig. 4. Left-to-right — STD-errors, sinogram and reconstructed image from polyethylene phantom 2D image, mercury, iron, air holes due to different axial and rotational motion: (a) reconstructed image, sinogram and STD errors without dislocation; (b—e) axial motion with distance 2, 4, 10, 20 mm respectively; (f—i) rotational motion with angle 3.65°, 7.3°, 21.9°, 40.15° respectively.
0
0
0
Dislocation Parameter
3.65°
(f)
50 r
Co 40
55
30
20
10 20 30 40 50 60 70 80
800 700 600 500 400 300 200 100
10 20 30 40 50 60 70 80
50
40 -30 -20 10 0
g—10 ■--20
Для дальнейшего прочтения статьи необходимо приобрести полный текст. Статьи высылаются в формате PDF на указанную при оплате почту. Время доставки составляет менее 10 минут. Стоимость одной статьи — 150 рублей.