УДК 551.324.54
Observation of ice-flow vectors on inner-continental traverses in East Antarctica
© 2010 г. A. Richter1, D.V. Fedorov2, A.K. Dvoryanenko2, S.V. Popov3, R. Dietrich1, V.V. Lukin4, A.Yu. Matveev2, M. Fritsche\ V.P. Grebnev2, V.N. Masolov3
'Technische Universitat Dresden - Institut ffir Planetare Geodisie, Dresden, Germany; 2ФГУП Аэрогеодезия, Санкт-Петербург; 3Морская полярная геологоразведочная экспедиция, Санкт-Петербург;
"Российская антарктическая экспедиция, Санкт-Петербург richter@ipg.geo.tu-dresden.de
Статья принята к печати 11 августа 2009 г. GPS-observations, ice flow, inner-continental traverse, marker, surface geometry, velocity vector.
Вектор скорости, внутриконтинентальный траверс, геометрия поверхности, ГПС-измерения, репер, течение льда.
During the Antarctic field seasons 2006/07 and 2007/08, geodetic fieldwork was carried out along the continental traverses Mirny-Vostok and Progress-Vostok in East Antarctica. Based on repeated GPS observations, horizontal ice flow velocities were determined for 10 markers with accuracies in the mm a-1 level. The obtained vectors are in general consistent with the regional ice sheet geometry. A significant impact of subglacial water cavities on ice-flow dynamics is identified.
Во время Антарктических полевых сезонов 2006/07 и 2007/08 гг. геодезические полевые работы были проведены во внутриконтинентальных научных походах от обсерватории Мирный и от станции Прогресс до станции Восток. На основе повторных GPS-наблюдений горизонтальные скорости течения ледника были определенны для десяти реперов с точностью около 1 мм/год. Полученные векторы в основном совпадают с местной геометрией поверхности ледника. Установлено значительное влияние подлёдных водоёмов на динамику течения ледника.
Introduction
The knowledge of the flow velocity field at the ice surface is fundamental for the understanding of glacier dynamics and the base for crucial scientific questions like the present-day ice mass balance. Although satellite remote-sensing methods have been applied successfully for the determination of flow velocity fields for fast-flowing glaciers, ice-shelves and Antarctica's coastal regions [6], these approaches are not suitable for the particular conditions in the Antarctic inland. This is true especially for the vast East Antarctic ice sheet, which is on one hand of great importance for global ice mass balance estimates and future sea-level rise predictions, and on the other hand still lacking reliable information about the ice-flow dynamics over large regions.
Therefore, in-situ ice flow measurements are still indispensable and of particular value in the remote regions of the East Antarctic interior. Such observations can be realised in the frame of continental traverses. The worldwide most outstanding traverse is the sledge convoy of the Russian Antarctic Expedition that every year covers the 1,415 km from observatory Mirny to Vostok station and back. This traverse passes three former Soviet Antarctic stations Komsomolskaya, Vostok-1 and Pionerskaya and, in addition to the famous subglacial lake Vostok, two smaller subglacial lakes discovered near Komsomolskaya and Pionerskaya stations [7].
In the Antarctic field season 2006/07 one geodesist joined the scientific traverse and the convoy from Vostok back to Mirny station. Along the convoy route, a number of geodetic
control markers were installed and observed for the first time with Global Positioning System (GPS) receivers. One year later, two geodesists joint the convoy and repeated the GPS observations on most of the control markers. In the Antarctic season 2007/08, an experimental convoy reached for the first time Vostok from Progress station. A geodesist participating in this outstanding operation was able to set up and observe a number of geodetic control markers along this traverse.
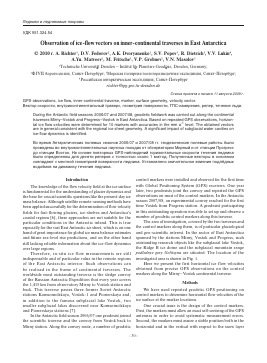
The area of investigation, covered by the two traverses and the control markers along them, is of particular glaciological and geo-scientific interest. In the sector of East Antarctica spanned by the stations Mirny, Vostok and Progress, such outstanding research objects like the subglacial lake Vostok, the Ridge B ice dome and the subglacial mountain range podlednye gory Golitsyna are situated. The location of the investigated area is shown in Fig. 1.
Here we present the first horizontal ice flow velocities obtained from precise GPS observations on the control markers along the Mirny—Vostok continental traverse.
Methods
We have used repeated geodetic GPS positioning on control markers to determine horizontal flow velocities of the ice surface at the marker locations.
One crucial issue is the design of the control markers. First, the markers must allow an exact self-centring of the GPS antennas in order to avoid systematic measurement errors. Second, the markers must assure a stable position both in the horizontal and in the vertical with respect to the snow layer
Fig. 1. Map of Antarctica and the area under investigation (1); 2 - continental traverses; 3 - GPS reference stations; 4 -Russian Antarctic stations
Рис. 1. Карта Антарктиды и район исследования (1); 2 — внутриконтинентальные траверсы; 3 — опорные станции GPS; 4 — российские антарктические станции
they are attached to. Third, the markers must allow finding and re-occupying them after one or more years taking into account the varying surface accumulation rates in the region under investigation. The specific logistic conditions on the scientific traverses have also to be considered. The markers used in the presented work, consist of aluminium tubes about 3 cm in diameter and 75 to 300 cm in length. Usually the tubes are plunged at least 50 cm deep into the snow. The shorter tubes were used only on the ice dome near Vostok station where accumulation is relatively low. They where plunged more than half their length into the snow and were supplemented by high bamboo stakes in order to mark the marker location. All the markers along the Vostok—Mirny traverse were found in immaculate state one year after their installation thus the applied signalization has proven effective.
During the observation sessions, GPS antennas were installed on top of the markers. The following types of GPS receivers were used: Trimble 4000SSi, Trimble R7, Leica 1200. All three utilized receiver types are geodetic two-frequency receivers and were set up to record raw GPS observation data (microwave codes and phases). In general, by using such instrumentation and the applied strategy, software and models for the data post-processing positioning accuracies of a few mm up to 1 cm can be achieved for the horizontal coordinate components. The vertical component is generally less accurately determined. The receivers were set up to a recording interval of 15 s and a horizon mask of 0°. The power supply was realised by 12 V gel accumulators, however, solar
panels had to be employed to avoid freezing of the accumulators at air temperatures below -50°C.
On the Vostok—Mirny traverse, the markers were occupied usually for at least four hours of observation. On the experimental traverse Progress—Vostok, however, the logistic constraints often did not allow such long observation durations; some of the observations were as short as 30 min. The observation duration is crucial for the determination of accurate marker coordinates.
3D coordinates for each marker were obtained from a post-processing of the recorded GPS data. For this, the scientific Bernese GPS software v 5.0 [3] was used. The coordinate determination was based on the differential method, using a set of five permanent GPS stations of the global IGS network as reference. These reference stations are situated on bedrock evenly distributed around the Antarctic coast and are shown in Figure 1. In order to achieve the desired positioning accuracy in the order of 1 cm, satellite orbits as well as reference station coordinates and velocities of highest accuracy and homogeneity have to be introduced and state-of-the-art models to correct for disturbing atmospheric, tidal and other effects have to be applied. In this study, we used the products from a reprocessing of continuous GPS data of a global network starting in 1994 [10].
One challenge for the differential coordinate determination consists in the long baseline lengths between our markers and the reference stations in the order of 103 km. The differential coordinate determination was based on the GPS carrier signal phases. A specific problem in the phase observation analysis consists in the resolution of so-called ambiguities. In the Bernese software, several ambiguity solution strategies are implemented which yield different coordinate accuracies in dependence of the baseline length. However, these ambiguity solution strategies require for their success minimum observation duration, that is, a minimum geometrical change in the satellite constellation throughout the observation. Therefore, and because of the dependence on baseline length and other factors, the accuracy of the determined coordinates does not increase linearly with the observation duration. The accuracy of the East coordinate component solutions for the GPS
Fig. 2. GPS positioning error at Vostok station as a function of the observation duration (explanations in the text) Рис. 2. Погрешность позиционирования GPS на станции Восток в зависимости от длительности наблюдения (объяснения см. в тексте)
Fig. 3. Velocity determination error as a function of the time basis between repeated GPS observations (explanations in the text). The inset in the upper right corner is a zoom into the longer time bases
Рис. 3. Погрешность определения скорости в зависимости от периода времени между повторными GPS-наблюдениями (объяснения см. в тексте).
B верхнем правом углу — фрагмент участка более продолжительных периодов в увеличенном масштабе
marker at Vostok station as a function of the observation period is illustrated in Fi
Для дальнейшего прочтения статьи необходимо приобрести полный текст. Статьи высылаются в формате PDF на указанную при оплате почту. Время доставки составляет менее 10 минут. Стоимость одной статьи — 150 рублей.