Pis'ma v ZhETF, vol. 99, iss. 1, pp. 19-24 © 2014 January 10
On nonlinear cascades and resonances in the outer magnetosphere
S. Savina1), E. Amatab, V. Budaeva,g, L. Zelenyia, E. A. Kronberg0, J. Buechnerc, J. Safrankovad, Z. Nemecekd,
J. Bleckie, L. Kozakf, S. Klimova, A. Skalskya, L. Lezhena
aIKI, Lab545, Moscow, Russia
bIFSI, Roma, Italy
cMax-Planck Institute for Solar System Research, 70569 Stuttgart, Germany dCharles University, 11636 Prague, Czech Republic eSpace Research Center, 57622 Warsaw, Poland f Kyiv Taras Shevchenko University, 01601 Kyiv, Ukraine 3National Research Centre Kurchatov Institute, 123182 Moscow, Russia
Submitted 17 July 2013 Resubmitted 21 Desember 2013
The paper addresses nonlinear phenomena that control the interaction between plasma flow (solar wind) and magnetic barrier (magnetosphere). For the first time we demonstrate that the dominant solar wind kinetic energy: (1) excites boundary resonances and their harmonics which modulate plasma jets under the bow shock; (2) produces discrete 3-wave cascades, which could merge into a turbulent-like one; (3) jet produced cascades provide the effective anomalous plasma transport inside and out of the magnetosphere; (4) intermittency and multifractality characteristics for the statistic properties of jets result in a super-ballistic turbulent transport regime. Our results could be considered as suggestive for the space weather predictions, for turbulent cascades in different media and for the laboratory plasma confinement (e.g. for fusion devices).
DOI: 10.7868/S0370274X14010044
Introduction. Interaction of the variable solar wind (SW) plasma flow with the Earth's magnetopause (MP - magnetospheric boundary) includes bow shock (BS) and turbulent magnetosheath (MSH) behind it (see the Inset in Fig. 1) [1]. The excited turbulence is often non-equilibrium, intermittent and non-stationary including plasma jets with the dynamic pressure being higher than that of SW. BS, MP and MSH possess numerous eigen modes: from membrane and cavity modes (0.2-10 mHz, described below) till ion cyclotron fluctuations (0.05-0.5 Hz). So, for a comprehensive understanding of turbulence properties one needs to fulfill multipoint multi-scale study with the simultaneous SW monitoring. We present such a case when the disturbed SW plasma flow drives directly MSH fluctuations and also pumps energy into resonant oscillations of the boundaries. Here we explore the spectral and statistical properties of the energy flow by analyzing the time series and wavelet spectra of the dominating dynamic pressure (Pdyn) taken at four different locations on space-
e-mail: ssavin@iki.rssi.ru
craft (s/c) DOUBLE STAR (DS), CLUSTER-4 (C4), GEOTAIL (GE), and ACE.
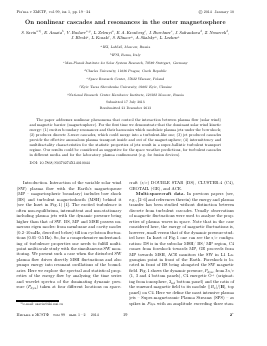
Multi-spacecraft data. In previous papers (see, e.g., [2-6] and references therein) the energy and plasma transfer has been studied without distinction between discrete from turbulent cascades. Usually observations of magnetic fluctuations were used to analyze the properties of plasma waves in space. Note that in the case considered here, the energy of magnetic fluctuations is, however, small versus that of the dynamic pressure studied here. In Inset of Fig. 1 one can see the s/c configuration: DS is in the subsolar MSH/ BS/ MP region, C4 comes from foreshock towards MP, GE proceeds from MP towards MSH, ACE monitors the SW in L1 La-grangian point in front of the Earth. Foreshock is located in front of BS being alongated the SW magnetic field. Fig. 1 shows the dynamic pressure, Pdyn, from 3 s/c (1,3 and 4 bottom panels), C4 energetic O+ (originating from ionosphere, 2nd bottom panel) and the ratio of the sunward magnetic field to its module (|BX|/|B|, top panel) on C4. Here we define the most intensive plasma jets - Super-magnetosonic Plasma Streams (SPS) - as spikes in Pdyn with an amplitude exceeding three stan-
nnctMa b «BT® tom 99 bho. 1-2 2014
19
2*
UT
■^dyn^sw
0 -20 -40 X GSE
Fig. 1. March 27, 2005, from top to bottom: CLUSTER-4 (C4) s/c, magnetic field \BX |/|B| with the X axis pointing at the Sun (see Inset). The shadowing indicates times during which \Bx\/\B\ > 0.5; Dynamic pressure normalized by the SW pressure, Pdyn/PSW; obtained by observations of the DOUBLE STAR (DS) s/c at a sampling rate of 4 s; C4s/c, Pdyn; C4s/c, CNO - channel of energetic particles (>274 keV, C+, N+ and O+, units - 1/cm2 • sr • s • keV) [7] Pdyn (MP - magnetopause, MSH - magnetosheath) obtained by the GE s/c. The Inset in the right bottom corner illustrates the observed interactions and magnetospheric boundaries
dard deviations a. Correlation of the SPS appearance on DS with the average \Bx\ dominance (|Bx|/|B| > 0.5, shadowed in Fig. 1) is seen from comparison of 1st and 2nd top panels. The spontaneous SPS appearance in the foreshock in front of the parallel BS is reproduced by the hybrid simulations [8]; the authors relay the Spontaneous Hot Flow Anomalies (SHFA, banded by the SPS [1]) with sunward streaming ions, generated at BS. These features agree both with the behavior of Transient Flux Events outlined in the early paper from the INTERBALL-1 s/c data [9], and with the recent statistical study of SHFA on THEMIS s/c [10].
Only less than 10% SPS on DS in Fig. 1 are sub-magnetosonic; in MSH the average magnetosonic Mach number, {Mms), is - 0.83 ± 0.83, for SPS
(Mms)SPs — 2.1 ± 1 with the maximum reaching 5.6. The average DS (Pdyn) — 0.58 (1.23-0) nP, for SPS (Pdyn)sps — 3.1 ± 1 with maximum 8.5 nP (for SW (Pdyn)sw — 1.8 ± 1 nP). More than 30% SPS on DS do not correlate with the SW disturbances. C4-DS cross-correlation in Pdyn is less than 22%.
Spectral analysis. In Fig. 2 we present the Morlet wavelet power spectra of Pdyn for 03-09 UT (Inset) to compare foreshock and BS/MSH and for 09-14 UT to compare the signals in the most disturbed region. For frequencies < 0.15 mHz one can see the direct driving of MSH in the BS vicinity by SW, i.e. the similar spectral peaks are seen with attenuation in 3-5 times in MSH. At 0.22-0.25 mHz (see vertical dashed lines) SW disturbances are absent for most time. In the foreshock such
Fig. 2. Power spectra of Pdyn for the major regions in Fig. 1 on 4s/c (see details in text). Inclined lines with squared values give average slopes. Inset: the same for 03-09 UT; grey lower curve - O+ from C4s/c
maximum appears first and, we suggest, it triggers the peak in MSH at — 0.23 mHz. A spectral maximum at —0.2 mHz on GE has the similar nature, the frequency downshift can be due to the Doppler shift, which falls downtail with the characteristic scales rising. This resonance could correspond to an eigen frequency for generation of shocklets or for the shock front overturning [11]. GE MP crossings (see vertical dashed line) are strongly modulated by this frequency.
A striking feature is the quite similar spectral peak at — 0.2 mHz in the intensity of energetic O+ (measured by RAPID on C4 [7], see bottom thick grey curve in Inset of Fig. 2), indicating the O+ outflow from magnetosphere into SW. The cross-correlation — 57% is between the O+ outflow on C4 and Pdyn on GE at 0408 UT (the time delay is —2100s). The average coherence at 04-08 UT between the O+ outflow on C4 and Pdyn on GE is - 85% at 0.2-2 mHz, being - 30% at 0320 UT. The magnetic pressure, Pb, is — 0.5 nP at the GE position (03-12 UT in Fig. 1), i.e. Pb < Pdyn in the MSH and the SW plasma transport can be controlled by the direct SPS penetration with an effectiveness up to an order of magnitude larger compared to other indirect mechanisms (cf. [1,12]). A peak at frequency fm — (0.5—0.6) mHz is visible mostly near BS
Письма в ЖЭТФ том 99 вып. 1-2 2014
with a power growth up to 10 times above the SW level. Both DS and C4 register pumping of the energy into a BS resonance which we attribute to BS membrane mode (an eigen surface BS mode, cf. [13]). A foreshock maximum at ~ 0.8 mHz could trigger this resonance. Another, cavity, mode [14-16] (at the frequency fc), has the following origin: MSH between BS and magnetosphere acts as a resonator for fast magnetosonic waves with eigen frequencies fcn being roots of the Bessel function Jn [14-16]. Further to the higher frequencies, a cascadelike slope of about -1 is established. The MSH/SW spectra at 0.2-10 mHz provide the evidence that the inherent foreshock/BS/MSH processes are strongly dominant [16].
Magnetic power Bx and |B| spectra on C4 at 0309, 09-14, 14-19 UT substantially differ from that of Pdyn: magnetic peak at 0.25 mHz is close to the Pdyn minimum, the magnetic slope of -0.4 at 1-20 mHz falls down to -1.7 at 20-100 mHz. Thus, most previous studies of magnetic turbulence are not representative versus the presented here data.
Bi-spectral analysis. We proceed analysis of Pdyn from DS by calculating of the wavelet bi-spectra. This analysis is helpful to detect 3-wave interactions and to reveal indications how large-scale modes regulate the
0.048
Fig.3. Wavelet bicoherence (bi-spectra) of Pdyn from DS s/c at 04-13 UT on March 27, 2005 for 120 mHz range. Inset: the lower frequency blow-up showing mainly discrete cascades (see details in the text)
plasma turbulence and resultant transports (e.g. it is used to prove the coupling between turbulence and zonal flows in fusion devices [17]).
The bi-spectra proves the 2nd harmonic generation at ~ 0.2 ± 0.05 mHz, which gives a large maximum (> 0.7, see the arrow root with the framed signature 3 • 02mHz in the Inset). The 3d harmonic (at ~ 0.6 ± 0.07 mHz, resonates with the BS membrane mode, fm ~ 0.6mHz, cf. [14]). At fm one can see a discrete horizontal cascade in Fig. 3 with maximum at 29-33 mHz. We use the term "discrete cascade" for 3-wave interactions with the frequency law: fi + f2 = f3 when the signal at the same frequency (in our case at the plot Y axis fi ~ marked in Fig. 3 by horizontal thick lines and by framed captures) interacts in turn with f3 and so on. A maximum at fi ~ fm is at the plot axis X ~ (1.4—1.8) mHz corresponding to th
Для дальнейшего прочтения статьи необходимо приобрести полный текст. Статьи высылаются в формате PDF на указанную при оплате почту. Время доставки составляет менее 10 минут. Стоимость одной статьи — 150 рублей.