ГЕНЕТИКА, 2013, том 49, № 10, с. 1202-1211
ГЕНЕТИКА ЖИВОТНЫХ
УДК 575.17:597.562
POPULATION GENETIC STRUCTURE AND GEOGRAPHICAL DIFFERENTIATION OF BURBOT (Lota lota) IN CHINA
© 2013 H. Fang1#, J. Zhang2#, N. Song2, L. Qian3, T. Gao2
1College of Marine Science and Engineering, Qingdao Agricultural University, Qingdao, Shandong, 266109 China
e-mail: gaozhang@ouc.edu.cn 2Institute of Evolution and Marine Biodiversity, Ocean University of China, Qingdao, Shandong, 266003 China 3Fisheries Technology Popularizing Station, Xinjiang Production and Construction Corps, Urumqi, Xinjiang, 832000 China
Received December 12, 2012
The burbot (Lota lota Linnaeus, 1758) is the only freshwater species of the family Gadidae. There is a longstanding controversy about taxonomic status of the burbot from the Amur River basin. It is necessary to investigate population genetic structure and geographical differentiation among burbot populations from the Irtysh River basin and Amur River basin by mitochondrial DNA nucleotide sequence analysis. A 572 bp segment of cytochrome b and 425 bp segment of control region gene were sequenced from 4 populations. The results showed that there was lower genetic diversity of burbot in China and highly significant genetic difference between populations in the Amur River basin (P < 0.01). Demographic analysis indicated that the burbot from the Amur River basin experienced population expansion (Cytb: FS = —0.912 (P = 0.287), D = —0.399 (P = 0.375); CR: FS = -4.771 (P = 0.015), D = -1.523 (P = 0.03 )). The data of 4 populations in China combining with the published data representing the Eurasian and North American burbot, revealed three distinct phylogenetic lineages (labelled EB, NA, Amur).
DOI: 10.7868/S0016675813070035
Burbot (Lota lota Linnaeus, 1758) is the only freshwater species from the family Gadidae. As a benthic and cold adapted carnivore, it mainly lives in slow-running rivers and oligotrophic lakes in Eurasia and North America, southward to about 40° N [1, 2]. In China, it distributes in the entire Amur River basin, Ir-tysh River basin and upper stretch of Yalu River [3]. Adults form spawning aggregations during the breeding season, which makes it possible that burbot populations within a certain geographical region are pan-mictic [4]. The small pelagic larvae engage in longrange dispersal while growing rapidly [5].
There is a longstanding controversy about subspecies partition of burbot. In previous studies, various subspecies have been described across the wide range of burbot according to different morphological criterion [6]. It was plausible about the partition of three subspecies and two subspecies according to morphological variation [7, 8]. Both of them, burbot from the Amur River basin attributed to Lota lota lota. But Kir-illov and Tyul'panov recognized burbot from the Amur River basin as a distinct subspecies basing on hypothetical consideration [9, 10]. Shi deduced that the burbot from the Amur River basin was possibly a distinct subspecies basing on the morphological analysis
# These authors contributed equally to this work.
[11]. Zhang drew the same conclusion according to the morphological and isozyme assay [12]. Yang insisted that systematic position of burbot from the Amur River basin was L. lota lota on the basis of morphological data [13]. Because the factors that influenced the morphological differences were unknown, it required more intensive taxonomic study to define a new subspecies.
With the development of DNA sequencing and PCR techniques, data from molecular genetics can play an important role in understanding of population biology and evolution of fish [14]. Cytochrome b (Cytb) and control region (CR) of mitochondrial DNA (mtDNA) were very useful indicators for studies on phylogenetic relationship and population genetic structure due to exclusively maternal inheritance and nonrecombinant nature of mtDNA [15—17].
Analysis of mitochondrial Cytb and CR reveals that two distinct lineages of burbot respectively correspond to the geographical occurrence of the subspecies L. lota lota (Eurasian-Beringian lineage) and Lota lota maculosa (North America lineage) [6, 18]. However no specimens from China were analyzed genetically. In the present study, population genetic structure and geographical differentiation of the burbot (Lota lota) from the Irtysh River basin and Amur River basin were
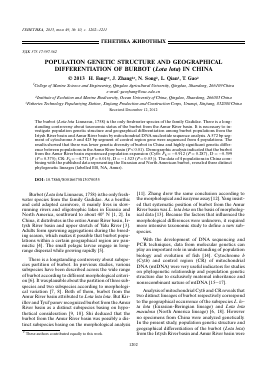
80° 85° 90° 95° 100° 105° 110° 115° 120° 125° 130° 135°
Fig. 1. Sampling sites of burbot in China. Populations are marked by abbreviations that correspond to Table 1.
examined using sequence analysis of mitochondrial Cytb and CR. Such knowledge on the genetic consequences of burbot may be critical for taxonomic status of burbot, the conservation strategy and sustainable management.
MATERIALS AND METHODS
Sampling and sequencing. One hundred and thirty specimens from 4 localities (Fig. 1, Table 1) were analyzed in the present study. Fresh muscles were collected and preserved in frozen or 95% ethanol for DNA extraction. Genomic DNA was extracted with the DNA extraction kit (Sangon, Shanghai, China) following the manufacturers instructions. The segment of Cytb gene was amplified with primers L14299Gm (5' - AATGATATGAAAAAC CAC -CGT-3') and H14942Gm (5'-ATTTGAGCCT-
GTTTCATGGA-3') [6]. CR was amplified with primers L19ProGM (5'- CCACTAGCTCCCAAA GCTA-GA-3') and HDL400L1 (5'-GATTTAGGATT-TATGTACTCC-3') [18]. Polymerase chain reaction (PCR) was carried out in 50ul volumes containing 1.25 U Taq DNA polymerase (Takara Co.), 10-100 ng template DNA, 200 nM forward and reverse primers, 200 |M of each dNTP, 10 mM Tris pH 8.3, 50 mM KCl and 1.5 mM MgCl2. A drop of mineral oil was added to cover the reaction mixture and all amplifications were performed on a Biometra thermal cycler (Biometra, Germany) with the following conditions: 3 min initial denaturation at 95°C, 35 amplification cycles including 45 s at 94°C for denaturation, 45 s at 52°C for annealing, 1 min at 72°C for extension and 5 min at 72°C for a final extension. All sets of PCR including one negative control reaction were checked for DNA contamination. 2 | L of each PCR product
Table 1. Burbot sample abbreviation, sampling site, date of collection, sample size, No. of haplotypes and genetic diversity indices for Cytb and CR
Abbreviation Sampling site Sequence Date of collection Sample size No. of haplo-types Haplotype diversity (h) Nucleotide diversity (n %) Mean number of pairwise differences (k)
Group Irtysh Cytb 50 2 0.082 ± 0.052 0.014 ± 0.031 0.082 ± 0.156
CR 66 5 0.380 ± 0.067 0.116 ± 0.112 0.492 ± 0.428
Is Irtysh River Cytb July 2005 22 1 \ \ \
CR July 2005 37 3 0.203 ± 0.084 0.062 ± 0.078 0.261 ± 0.296
Bq Burqin River Cytb May 2011 28 2 0.148 ± 0.089 0.030 ± 0.040 0.148 ± 0.217
CR May 2011 29 4 0.552 ± 0.079 0.178 ± 0.150 0.749 ± 0.570
Group Amur Cytb 66 5 0.590 ± 0.035 0.122 ± 0.104 0.694 ± 0.533
CR 64 10 0.702 ± 0.050 0.239 ± 0.180 1.014 ± 0.690
Sy Songye Lake Cytb June 2010 26 7 0.456 ± 0.132 0.116 ± 0.104 0.655 ± 0.529
CR June 2010 30 8 0.693 ± 0.063 0.211 ± 0.169 0.893 ± 0.644
Db Duobuku'er Cytb September 2004 40 3 0.522 ± 0.040 0.096 ± 0.090 0.542 ± 0.458
River CR September 2004 34 5 0.611 ± 0.067 0.178 ± 0.150 0.758 ± 0.571
was used for 1% agarose gel electrophoresis to verify the amplified fragment length with a DNA ladder (Sangon, Shanghai, China). The DNA was visualized by staining with ethidium bromide under ultraviolet light. PCR product was purified with Gel Extraction Mini Kit (Watson Bio Technologies Inc., Shanghai). The purified product was used as the template DNA for cycle sequencing reactions performed using Big-Dye Terminator Cycle Sequencing Kit (ver. 2.0, ABI), and run on an ABI Prism 3730 automatic sequencer according to the manufacturer's instructions. The primers used for sequencing were the same as those for PCR amplification.
Data analysis. All sequences were edited and aligned using Dnastar software (Dnastar, Inc.). Genetic diversity indices such as number of haplotypes, polymorphic sites, transitions, transversions and in-dels were obtained using the program Arlequin version 3.5 [19]. The haplotype diversity (h), nucleotide diversity (n) and the mean number of pair-wise differences (k) were calculated using the program Arlequin version 3.5 [19, 20]. Populations were grouped as Irtysh and Amur according to hydrological regions. The gamma distribution shape parameter for the rate heterogeneity among sites was calculated using the program Modeltest Version 3.06 [21]. The neighbour-joining (NJ) tree of the haplotypes was constructed using MEGA 5.0 and evaluated with 1000 bootstrap replicates [22]. Genetic distances were generated for phy-logenetic reconstruction using models of substitution suggested by Modeltest Version 3.06 [21]. The model (HKY +r, r = 1) was used to analyze the data of Cytb. The best fit for the CR data was HKY model with invariable sites and gamma shape parameter (HKY + I + r, I = 0.804, r = 0.442) [23].
Population genetic structure was measured with an analysis of molecular variance (AMOVA) incorporating sequence divergence between haplotypes [24]. To test our hypotheses, we conducted AMOVA analysis with two groups representing two basins. Genetic differentiation between pairs of population samples was evaluated with the pairwise fixation index FST [24]. The significance of the FST was tested by 10000 permutations for each pair-wise comparison in Arlequin. When multiple comparisons were performed, P values were adjusted using the sequential Bonferroni procedure [25].
Historical demography of L. lota from the Amur River basin was examined by neutrality tests and mismatch distribution analysis [26, 27]. The D test of Taji-ma (1989) and FS test of Fu (1997) were used to test for neutrality [26, 27]. Significant negative D and FS statistics can be interpreted as signatures of population expansion. Historical demographic expansions were al
Для дальнейшего прочтения статьи необходимо приобрести полный текст. Статьи высылаются в формате PDF на указанную при оплате почту. Время доставки составляет менее 10 минут. Стоимость одной статьи — 150 рублей.