Pis'ma v ZhETF, vol.93, iss. 1, pp.34-36
© 2011 January 10
"Quasi-Planck" spectra of capillary turbulence on the surface of liquid
hydrogen
M. Yu. Brazhnikov1L. V. Abdurakhimov, S. V.Filatov, A. A. Levchenko Institute of Solid State Physics RAS, 142432 Chernogolovka, Russia
Submitted 18 November 2010
We report the first observation of "quasi-Planck" spectra of capillary turbulence on the surface of liquid hydrogen in the dissipation domain. Capillary waves have been driven by low-frequency random force. We have observed that the frequency spectrum of surface elevation changes its dependence from power-like (l^wl) ~ w-2'8 at middle-frequency domain to "quasi-Planck" distribution ~ at higher frequencies.
The frequency ua is proportional to the boundary frequency between inertial interval and dissipation domain and it is scaled up with the increase of driving force.
Introduction. The theory of weak turbulence [1] describes numerous systems of weakly interacting waves: ripples on water and gravity waves on the surface of oceans, Rossby waves in the atmosphere of planets and in the World ocean, Langmuir waves in plasma and spin waves in magnetics. Relatively low viscosity of liquid hydrogen, its low density and the possibility to excite waves on the charged surface by electrical force reveal a unique opportunity for experimental studies of weak wave turbulence. The use of liquid hydrogen for experiments on wave turbulence has already allowed us to study phenomena predicted by the theory, e.g. Kolmogorov-Zakharov steady state spectra of capillary turbulence in a wide range of frequencies [2], as well to observe new ones which have been explained successfully in the framework of the weak turbulence approximation: quasiadiabatic decay of capillary turbulence [3] and suppression of high-frequency turbulent oscillations by additional low-frequency driving force [4].
The weak wave theory predicts an existence of stationary non-equilibrium state in a system of interacting capillary waves - Kolmogorov-Zakharov spectrum for the spectral density of energy e(k) of waves inside inertial interval [5]:
e(k) ~ P1 H- 7 1.
(1)
Using relation between the spectral density e(k) and pair correlation function of the surface elevation rj(r,t), and taking into account the dispersion law for capillary waves ui(k) ~ fc3/2, one can obtain the frequency spectrum of correlation function (rj(t + T)r](t)):
{\rj2J) ~ (ak^e^idw/dk)-1 ~ Pl/2u; l7/0. (2)
This stationary spectrum is characterized by a single quantity P - the energy flux directed towards large fre-
quencies w. At high frequencies the energy transferred is dissipated due to viscous losses and the turbulent cascade is destroyed, therefore to sustain distribution (2) or (1) constant in time the system must be permanently pumped with energy at low frequencies. The high-frequency boundary of the inertial interval where the distribution (2) is still valid, can be estimated from assumption that the time of viscous damping tv(w) and the time of nonlinear interaction Tni(w) are of the same order of magnitude for waves at the frequency this gives us [5]:
6/5
' 2 17/6 \6/5 \
(3)
where rjq is mean squared amplitude of the wave at some low frequency u>o, v is kinematic viscosity of liquid.
At frequencies above w<i the spectrum depends both on details of dissipation and nonlinear interaction. When waves in dissipation region w w4 interact mainly with each other than with waves from inertial range w -C u)d the wave distribution should be close to exponential one [6]. Detailed consideration gives the "quasi-Planck" spectrum for dissipation tail of the correlation function [7]:
\nl\)
(4)
e-mail: makc0issp.ac.ru
where s is some constant. The numerical simulations for discrete kinetic equation [7] has confirmed exponential dependence of the wave occupation numbers in the domain of strong damping.
Here we report the first experimental observations of turbulent spectra of the capillary waves in dissipation region driven by low frequency random force on the surface of liquid hydrogen.
Experimental techniques. The experimental setup consists of optical cell placed inside the vacuum space
"Quasi-Planck" spectra of capillary turbulence
35
of helium cryostat and optical system for registration of oscillations on the surface of liquids. A conductive cylindrical vessel 6 mm in depth and 60 mm of inner diameter was mounted inside the cell and a flat conductive plate was fixed at 4 mm above the vessel. Gaseous hydrogen has been condensed into the vessel. Radioactive plate located at the bottom of vessel has ionised the liquid hydrogen. In the presence of dc voltage of about 1 kV between the vessel and upper plate ions have been separated and charges with the sign corresponding to the polarity of dc voltage have been accumulated under the surface of liquid hydrogen. Additional ac voltage up to maximum value 100 V was used to excite waves on the surface of liquid.
The use of electric field for driving capillary waves makes a great advantage comparing with the usual techniques for exciting waves on the water surface, e.g. via Faraday instability. It allows us to drive the surface accurately by sufficiently well controllable force. In this set of experiments we have used low-frequency random signals as a driving ac voltage. The signals have been synthesised via Fourier transform from random set of phases and a boxcar like amplitude spectrum, which is non-zero only inside some frequency interval (pumping range).
We use the laser reflection method to detect waves on the surface of liquid. A laser beam incident at small sliding angle (about 0.2 rad) on the surface of liquid is reflected and focused by lens onto photo-detector. The voltage from photo-detector is amplified and digitised by 24-bit analog to digital convector with sampling frequency of about 100 kHz. Waves are detected in regime of "wide beam", when size of the laser spot is greater than typical wave length. The power of reflected light P(t) in this regime is proportional to the surface elevation r](t) [8]. For this reason we will not make the difference further for spectra of the correlation function of surface elevation and the reflected beam power
<raThe maximum wave steepness that can be registered in our experimental setup is limited by sizes of optical windows in cryostat and it is approximately equal to 0.05.
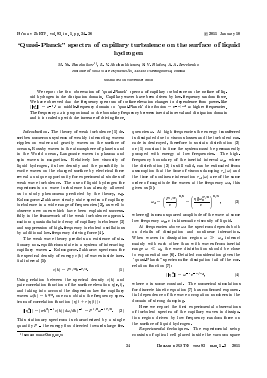
Experimental results and discussion. Capillary waves have been excited by random force in a frequency range 39-103 Hz. The root mean square of driving voltage was varied from Vp = 0 V, i. e. no pumping at all, up to maximum value Vp = 30 V limited mainly by the maximum allowed wave steepness. Fig.l demonstrates Fourier spectra of reflected laser beam power Pj for different amplitudes of driving force. The excitation range can be easy seen at low frequency part of all spectra.
Frequency (Hz)
Fig.l. Spectra of surface oscillation Pj excited by random force in a frequency range 39-103 Hz at different amplitudes of driving force. The rms of driving voltage Vp is changed from 4 to 30 V. Darker line corresponds to stronger driving force. The arrow indicates the high-frequency boundary of the inertial interval uii, « 4 kHz for driving voltage Vp = 30 V
The excitation range is followed by inertial interval -relatively wide frequency domain where spectrum Pj exhibits power-law dependence (2). The width of inertial interval depends on drive amplitude. When the surface is excited by weak force Vp = 4 V the dissipation starts nearly from the excitation range and no inertial interval is observed. Increasing the driving force leads to broadening the inertial interval, the high-frequency boundary wj of inertial interval shifts towards higher frequencies. The widest inertial range from « 0.3 kHz to wj « 4 kHz is seen for maximum driving voltage Vp = 30 V. At frequencies above the high-frequency boundary surface oscillations degrade due to viscous losses, curves Pj go down smoothly and hide finally below the level of apparatus noise.
Turbulent spectra replotted in linear scale in Fig.2 demonstrate that the decrease of wave amplitudes at frequencies above the high-frequency boundary of inertial range can be approximated good enough by the exponential decay Pj ~ eru-'/u-'d in some interval. Fitting procedure is consistent with initial assumption w<i, the resulting fitting parameter is considerably less than frequencies from fitting interval. For examples, spectrum at Vp = 26 V is approximated in the range of 59 kHz with Wd k, 0.6 kHz. Unfortunately, narrow fitting interval does not allow to establish exponent a of the "quasi-Planck" (4) distribution accurately. Fitted w<i is also several times less than visible boundary between inertial and dissipation domains (see Fig.2). This discrepancy can be attributed to a certain degree to a freedom
36
M. Yu. Brazhnikov, L. V. Abdurakhimov, S. V. Filatov, A. A. Levchenko
5
un
1
M
o
1
0
4 6
Frequency (kHz)
Fig.2. Spectra P2 for driving voltage Vp = 8 V (light grey), 16 V (grey) and 26 V (dark grey) in linear scale. Dotted line - power-law distribution ~ w-2'8, dashed lines - fit-Ud is approximately equal to 0.2, 8, 16 and 26 V correspondingly
ting functions ~ e "/"J. 0.4 and 0.6 kHz for Vv
in definition of the boundary frequency (3), which can be renormalized by some constant.
The boundary of viscous damping u>d obtained from fitting spectra by exponential decay in dissipation interval grows with the increase of driving force. We use surface response rj0, namely the absolute value of Pw at frequency of 53 Hz (location of the maximum of Pj distribution inside excitation range), as a measure for excitation level. The quantity rj0 is directly proportional to the mean wave height at the same frequency. Fig.3 shows
3
s
M
o
21—1—1
3.6 3.8 4.0 4.2 4.4 4.6 log^0
Fig.3. Dependence of viscous boundary u>d (black dots) on mean height of low-frequency wave rjo, grey line
Для дальнейшего прочтения статьи необходимо приобрести полный текст. Статьи высылаются в формате PDF на указанную при оплате почту. Время доставки составляет менее 10 минут. Стоимость одной статьи — 150 рублей.