УДК 551.324.43
Spatial distribution of the snow accumulation rate along the ice flow lines between Ridge B and Lake Vostok
© 2012 г. A.A. Ekaykin, V.Ya. Lipenkov, Yu.A. Shibaev
Arctic and Antarctic Research Institute, St. Petersburg ekaykin@aari.ru
Статья принята к печати 7 сентября 2012 г.
Antarctica, ice flow lines, snow accumulation, snow density, snow isotope content, spatial variability.
Аккумуляция снега, Антарктида, изотопный состав, линии тока льда, плотность снега, пространственная изменчивость.
During the 45th-57th Russian Antarctic Expeditions (1999-2012) an intensive program of glaciological and geophysical observations have been carried out in the region between the subglacial Lake Vostok and the Ridge B, Central Antarctica. In this work we present the instrumentally obtained snow accumulation data along the northern (NVFL) and southern (VFL) ice flow lines passing through the Lake Vostok. The mean accumulation rate at the NVFL and VFL profiles is 29-37 kg m-2 yr-1 and 21-24 kg m-2 yr-1, respectively. Thus, this region is characterized by a strong latitudinal gradient of the snow accumulation rate, while the longitudinal one is an order of magnitude less. The spatial distribution of the accumulation rate along the VFL is characterized by a sharp variability attributed to the snow re-deposition due to the wind interplay with the local glacier surface slope anomalies. The new data on the stable water isotope concentration (518O) along the VFL profile are also presented.
Introduction
Interpretation of the climatic information recorded in the Vostok deep ice core is related to a number of methodological difficulties, one of them is due to the fact that the Vostok station is situated about 300 km from the nearest ice divide. It means that ice found at certain depth was deposited not at the drilling site, but some distance upstream along the ice flow line. To account for this ice advection effect, sophisticated two-dimensional ice flow models are employed [15]. The parameters needed to run the models are bedrock relief, glacier thickness, basal conditions, as well as spatial distribution of snow properties and accumulation rate along the ice flow line. Nevertheless, until recently the glaciological data in the region of interest, located between the Ridge B and the Lake Vostok (Fig. 1), were rather scarce. The data on the snow density, accumulation rate and isotope content (concentration of deuterium, 6D, and/or oxygen 18, 618O) were available along the Vostok-Mirny route [4] and at the site of Dome B deep drilling [12]. An attempt to calculate the spatial distribution of the long-term accumulation rate values along the Vostok flow line using the radio echo sounding data on internal glacier layering was made in [13]. To fill up the data gap, an intense program of glaciological and geophysical investigations in the region of interest was launched during the 45th summer season (December 1999 - January 2000) of Russian Antarctic Expedition (RAE) by the specialists of Arctic and Antarctic Research Institute and Polar Marine Geosurvey Expedition (PMGE) with the logistical support from the RAE.
Aside from collecting data along the ice flow lines needed to interpret the deep ice core data, this activity was aimed at
following: 1) to study the spatial distribution of the snow properties, isotope and chemical content, and accumulation rate, as well as ice thickness, in the regions of Lake Vostok and between the lake and the Ridge B; 2) to reconstruct the climate variability in this region over the past 200-300 years; 3) to define the site of a future deep ice drilling to obtain the undisturbed climatic record for the past 1-1.5 million years.
In 1999-2004 the glaciological and geophysical (radar echo and seismic soundings) investigations were mainly restricted to the area of lake Vostok, which allowed to describe in detail the lake's morphology [14] and collect a vast dataset of glaciological information (to be published elsewhere). During the 50-55 RAE summer seasons (20042010) the glaciological works were extended to the region between Lake Vostok and the Ridge B with the focus on the Vostok ice flow line and the northern Vostok flow line (profiles VFL and NVFL in Fig. 1), as well as to the larger sector of East Antarctic ice sheet located between the sites Progress, Dome B, Vostok, Komsomolskaya and Mirny. Some preliminary results of these studies are summarized in [2]. In particular, in this work the spatial distribution of the ice thickness, snow density and isotope content along the VFL is presented. The isotopic analyses of the snow samples from shallow hand-drilled cores and deep pits accompanied by the dating of the snow-firn thickness has allowed to reconstruct the regional (for the southern part of Lake Vostok) climate history over the past 350 years [3].
Finally, during the last Antarctic summer season (December 2011 - January 2012) the snow stakes installed at the VFL and NVFL profiles were revisited having made possible to measure instrumentally the present-day spatial distribution of the snow accumulation rate along the flow
A.A. Ekaykin et al.
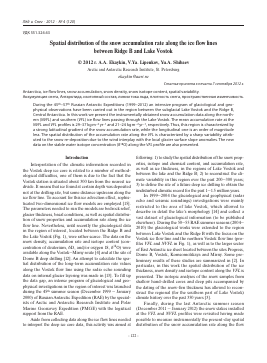
95° 100° 105° 110° E
Fig. 1. The map of the area of study. The red dots are the pits and snow cores mentioned in the paper. The green color depicts the studied intervals of the northern and southern ice flow lines (NVFL and VFL) passing through the subglacial Lake Vostok. The numbers are the snow accumulation rate values (kg m-2 yr-1): previously published (black) [4, 12] and obtained as a result of this study (red and green). The dotted line is the route of the old Vostok-Mirny logistical traverse Рис. 1. Карта района исследований. Красные кружки — расположение шурфов и скважин, упомянутых в настоящей работе. Зелёным цветом выделены исследованные участки северной и южной линий тока льда (NVFL и VFL), проходящих через подледни-ковое озеро Восток. Цифрами показаны скорости снегонакопления (кг м-2 год-1): опубликованные ранее (чёрным) [4, 12] и полученные в ходе настоящего исследования (красным и зелёным). Точечная линия — старая трасса транспортного похода Восток-Мирный
lines passing through the Lake Vostok, which is the main subject of this paper. The present work is a Russian contribution to the International Polar Year projects N 301 TASTE-IDEA (Trans-Antarctic Scientific Traverses Expedition - Ice Divide of East Antarctica) and N 205 IPICS-IPY (International Partnership in Ice Core Science - International Polar Year Initiatives) [6].
Methods and results
During the 50th RAE summer season (January 2005) glaciological observations were carried out along the Vostok ice flow line (VFL profile in Fig. 1) from Vostok to 96th km uphill towards the Ridge B. In total, 78 snow stakes were set up (every 1 km in the interval 0-60 km from Vostok and every 2 km in the interval 60-96 km). Three shallow pits were excavated (¡135, /159 and /196 as indicated in Fig. 1) followed by snow stratigraphy description and snow sampling for isotope content and total beta-activity. The latter allowed to define the 1955 high beta-activity layer and thus to absolutely date the snow thickness. The snow samples of the upper 1.5 m of snow were also taken near each stake to define the isotope composition. Next year the VFL profile was prolonged until the 107th km from Vostok with the snow stakes set up every 1 km. In the end of the profile (point VFL-1 in Fig. 1) a snow core was retrieved to the depth of 14.8 m. The methods of these works are described in details in [2].
In January 2012 (57th RAE summer season) the glaci-ological works at the VFL profile were repeated. For the
first time in the history of Russian Antarctic Expedition it was made using ski-doo snow-mobiles (Fig. 2). The height of each snow accumulation stake was re-measured, which allowed to calculate the total snow build-up over the 7-year period, from 2005 to 2011 (or over 6-year period, 2006-2011, for the stakes 80-90 located at the distance of 97-107 km from Vostok). The average measured total snow build-up is 44.4 cm for stakes 1-79 and 41.3 cm for stakes 80-90.
The build-up data were first corrected for the snow settling as described in [1] (see also [7]). The mean value of the correction is 0.7 cm, or about 1.5% of the total snow build-up.
In order to transform the snow build-up into the accumulation rate, the snow density data were applied. During the RAE57 traverse, two types of density measurements were made: near each stake the density of the upper 20 cm snow layer was defined (Fig. 3) according to the routine technique used at Vostok station [1], and also the upper 50-cm density was measured at each 10th stake. Between 20-cm (p20) and 50-cm snow density (p50) a linear relationship was found p50 = 0,226 p20 + 28 6 (significant with 90% probability), which was then applied to calculate the snow density in the upper 50 cm for each VFL point. We should note that choosing 20-cm or 50-cm density changes the final accumulation values by about 5%, and that the variability of the accumulation rate along the VFL depends almost entirely on the snow build-up and only to minor extent on the density.
Fig. 2. Glaciological traverse along the VFL profile, 57th RAE (January 2012) with the use of ski-doo snowmobiles. Photo by V. Zarovchatsky Рис. 2. Гляциологический поход по профилю VFL, 57-я РАЭ (январь 2012 г.), на базе снегоходов Ski-doo. Фото В. Заровчатского
Thus, the average (for the 6-7 year period) snow accumulation rate for every stake is calculated as the total snow build-up corrected for snow settling, multiplied by the 50-cm snow density and divided by the number of years passed since the stake set-up (see Fig. 3). Also, during the 57th RAE summer season samples of the surface snow were collected near 24 stakes (at the distance of 11, 12, 17, 31, 34, 44, 48, 55, 56, 59, 72, 74, 76, 97-107 km from Vostok) in order to confirm the spatial distribution of the isotopic content.
The NVFL stake p
Для дальнейшего прочтения статьи необходимо приобрести полный текст. Статьи высылаются в формате PDF на указанную при оплате почту. Время доставки составляет менее 10 минут. Стоимость одной статьи — 150 рублей.