log /, A
-0.80 -0.70 -0.60 - 0.50
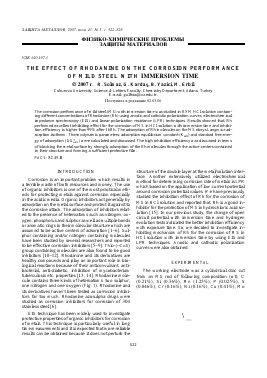
Fig. 2. Cathodic (a) and anodic (b) polarization curves of MS in after 1 and 168 h.
(0.017%), Sn (0.017%), Al (0.003%), V (0.081%) and Fe (balk). Platinum in dimension of 1 x 1 cm2 and the Ag/AgCl-, Cl-(sat.) electrodes were used as counter electrode and reference electrode, respectively. The MS specimens were coated with polyester, aspect for a measurement area of 0.50 cm2 and electrical conductivity was provided by a copper wire. The surface of the working electrode was mechanically abraded with a series of emery paper, which ended with the 1000 grit. Then it was cleaned with double distilled water, de-greased in CCl4, washed thoroughly with distilled water and finally dried with filter paper.
All the tests were performed in 0.5 M HCl solution free and containing different concentrations of Rh (1.0 x 10⁻², 1.0 x 10⁻³, 1.0 x 10⁻⁴ M) under unstirring conditions at room temperature and the test solutions were opened to the air. All the tests were prepared by using bidistilled water. MS electrodes were immersed in a beaker which contains 200 mL of test solutions and after different immersion times EIS and LPR measurements were achieved.
Electrochemical tests were carried out by using a CHI 604 instrument with serial number 6A721A. Anodic and cathodic polarization curves were recorded potentiodynamically starting from open circuit potential with a scan rate of 5 mVs-1. EIS measurements were performed at open circuit potential. The frequency range was between 105-10-3 Hz and amplitude was 7 mV peak-peaks. Linear polarization measurements were carried out by recording the potential ±7 mV around open circuit potential at a scan rate of 0.001 Vs-1.
RESULTS AND DISCUSSION Potentiodynamic Polarization
Cathodic and anodic polarization curves of MS in 0.5 M HCl and 1.0 x 10⁻² M Rh containing solutions af-
log /, A
-0.55 -0.45 -0.35 -0.25 -0.15
-0.50 -0.40 -0.30 - 0.20 E, V blank (frame circle) and 1.0 x 10⁻² M Rh (solid circle) solutions
ter 1 and 168 h are presented in Fig. 2 (to present data clearly, figures of the other concentrations were not given). As would be expected both anodic and cathodic reactions of corrosion process were inhibited. This result indicates that, the addition of Rh in hydrochloric acid solution blocking the active centers by adsorption on the metal surface. As a result, the strong adsorption reduces anodic dissolution of iron and also retards hydrogen evolution reaction. In the anodic curves (Fig. 2b), for potential higher than -150 mV, Rh molecules don't affect the polarization curves. This means that, the inhibition mode of this compound is depending on the electrode potential. The same behaviour have been reported for other organic compounds [16, 17] and attributed to the dissolution of MS, leading to desorption of organic inhibitor from electrode surface. At these potentials, desorption rate of molecule is higher than adsorption rate. However, this compound performed a good inhibition effect at more negative potentials than -150 mV which named as desorption potential. It is clear from Fig. 2 that, the inhibition of anodic and ca-thodic reactions increased with immersion time while currents for blank solution increase. It is indicating formation of a protective film on the MS surface in Rh containing solutions with time.
Electrochemical Impedance Spectroscopy
To evaluate the evolution of corrosion process over time, impedance diagrams were obtained regularly at different immersion times up to 168 h. After 1 h of immersion, Nyquist plots (Fig. 3a) contained only one depressed semi-circle and phase-log freq plots (Fig. 4a) gave only one capacitive time-constant. It is clear from Fig .3a that, the impedance response of MS has significantly changed after addition of inhibitor to hydrochloric acid solution. The diameter of capacitive loop was increased with increasing inhibitor concentration.
- Z ", Ohm 500 400 300 200 100
0
-Z", Ohm
(a)
600 500 400 300 200 100
450 400 350 300 250 200 150 100 50
200 400 600 800 1000
(c)
0
blank
<
3 6 9 12 15 18 21 24 27 30
1.0 x 10⁻⁴ m 450 400 350 300 250 200 150 100 50
(b)
blank
j
JL
0
. .4. 8 12 13 20 24 28 32 36
J_i I
200 400 600 800 1000 1200 (d)
1.0 x 10⁻⁴ M
¿aL
blank
3 6 9 12 15 18 21 24
0
200 400 600 800 1000
00
0 200
200 400 600 800 1000 Z ', Ohm
Fig. 3. Nyquist plots of MS after 1 h ( a), 24 h (b), 120 h (c) and 168 h (d) (O = blank; A = 1.0 x 10⁻⁴ M; □ = 1.0 x 10⁻³ M; • = 1.0 x
x 10-2 M).
Fig. 3b shows the impedance diagrams of MS after 24 h of immersion time. It can be seen from Fig. 3b that, Nyquist diagrams of inhibited solutions showed only one capacitive loop with a straight line at high frequencies. After 24 h, polarization resistance of MS in 1.0 x 10⁻² M Rh containing solution increased when compared to the 1 h. In contrary, in blank solution a decrease in polarization resistance was observed. These results suggest that, a protective organic film was forming on the metal surface and this film is enhanced with immersion time.
After 120 h immersion time (Fig. 3c), for blank solution, Nyquist plot showed a single depressed semicircle and one time-constant in phase-log freq plots (Fig. 4c). In inhibitor containing solutions a different behaviour was observed in contrary to the short immersion times. Nyquist plots showed two capacitive loops and two well-defined time constants in Bode format. First loop appearing at high frequencies was attributed to the charge transfer resistance (^ct) and diffuse layer resistance (Rd). After adsorption of inhibitor molecules on the MS surface, at first Rh dissolves metal and later, form a stable complex with iron ions. This is resulting by formation of an insoluble resistive layer at metal surface. The second loop was attributed to the film resistance (Rf) and accumulated kinds (corrosion products, inhibitor molecules etc.). The two constants become
more and more distinct as the immersion time increases (Fig. 3d and Fig. 4d).
In the evaluation of Nyquist plots, the difference in real impedance at lower and higher frequencies is considered as charge transfer resistance. When the metal/solution interface is analyzed, charge transfer resistance must be corresponding to the resistance between the metal/OHP (outer Helmholtz plane). The contribution of all the resistances correspond to the metal/solution interface i.e. charge transfer resistance (Rct), diffuse layer resistance (Rd), accumulation resistance (Ra), solution resistance (Rs), etc. must be taken into account. So, the difference in real impedance at lower and higher frequencies must be considered as polarization resistance (Rp) [18, 19]. The double layer can be represented by the electrical equivalent circuit diagrams to model metal/solution interface. The corresponding electrical equivalent circuit model for short immersion times which consist of one time constant is given in Fig. 5a (MODEL A). Polarization resistance, which corresponds to the diameter of Nyquist plot, contains charge transfer resistance and diffuse layer resistance (adsorbed inhibitor molecules, corrosion products, ions and other all accumulated kinds). Equivalent circuit model corresponding to long immersion time which
Fig. 4. Phase-log freq plots of MS after 1 h (a), 24 h (b), 120 h (c) and 168 h (d) (O = blank; A = 1.0 x 10⁻⁴ M; □ = 1.0 x 10⁻³ M; • = 1.0 x 10⁻² M).
contains two time constant for inhibitor containing solutions is given in Fig. 5b (MODEL B).
Polarization resistance and inhibition efficiency of MS in HCl solution free and containing various concentrations of Rh obtained from Nyquist plots are given
in Table 1. The inhibition efficiency was calculated from polarization resistance, as follows;
( R p - Rl\ IE(%) = ( pR pj 100.
(1)
Table 1. Polarization resistances of MS in 0.5 M HCl solution free and containing different concentrations of Rh after different immersion times
t/h Blank 1.0 x 10⁻⁴ M 1.0 x 10⁻³ M 1.0 x 10⁻² M
Rp, O *Rp, O Rp, o *Rp, O IE, % Rp, O *Rp, O IE, % Rp, O *Rp, O IE, %
1 45 44.0 345 290 87.0 600 571 92.5 1000 979 95.5
4 40 32.7 360 322 88.9 580 524 93.1 1130 1103 96.5
24 30 24.1 180 175 83.4 510 485 94.1 1375 1179 97.8
48 18.3 20.0 115 108 84.1 420 433 95.6 1200 1140 98.5
72 11.6 16.5 85 79.4 85.4 380 360 97.0 1100 1020 99.0
96 8.4 12.0 60 53.5 84.3 375 287 97.8 1100 1060 99.2
120 6.6 6.9 26 29.3 74.6 320 300 97.9 1100 1031 99.4
168 4.8 5.3 18.7 24.3 74.3 280 263 98.3 1100 1058 99.6
Rp : Determined from EIS. * Rp : Determined from LPR.
Table 2. Double layer capacitance of MS after different immersion times
t/h Blank 1.0 x 10⁻⁴ M 1.0 x 10⁻³ M 1.0 x 10⁻² M
Cdl, F Cdl, F Cf, F Cdl, F Cf, F Cdl, F Cf, F
1 4 168 9.45 x 10⁻⁴ 12.88 x 10⁻⁴ 8.92 x 10⁻² 1.81 x 10⁻⁴ 3.73 x 10⁻⁴ 3.34 x 10⁻⁴ 3.13 x 10⁻² 2.16 x 10⁻⁴ 2.81 x 10⁻⁴ 1.16 x 10⁻⁴ 1.01 x 10⁻² 1.11 x 10⁻⁴ 2.12 x 10⁻⁴ 2.76 x 10⁻⁴ 1.50 x 10⁻²
Where Rp and Rp are polarization resistances of MS respectively. It is clear from Table 1 that, by increasing in inhibited and uninhibited hydrochloric acid solution, immersion time inhibition efficiency increased.
Double layer capacitance (Cdl) was calculated from the frequency at which the imaginary component of the impedance is maximum (-Zmax"), using Eq. (2) and pre-(a) Cdl sented in Table 2.
Rs
Rct Rd
MODEL A
Rp = Rct + Rd (Rd = Rdif + Ra)
f(
1
(-Zmaz" )
2rcCdlR
(2)
dFvp
The Cdl values were decreased with increasing inhibitor concentration. The decrease in the Cdl which can result from a decrease in local dielectric constant and/or an increase in the thickness of the double layer was attributed to the adsorption of the inhibitor molecule on the metal surface [8, 20-21]. The thickness of the protective layer, 5org, was related to the Cdl by the following equation [22].
Cf
MODEL B
Rp = Rf + Rpor (Rpor = Rct + Rd)
Cdi _
£n £r
(3)
Where, e0 is the vacuum dielectric constant and £r is the relative dielectric constant.
3.3. Lin
Для дальнейшего прочтения статьи необходимо приобрести полный текст. Статьи высылаются в формате PDF на указанную при оплате почту. Время доставки составляет менее 10 минут. Стоимость одной статьи — 150 рублей.