ОПТИКА И СПЕКТРОСКОПИЯ, 2013, том 115, № 5, с. 716-729
ОТЕКТРОСКОПИЯ АТОМОВ И МОЛЕКУЛ
УДК 539.19
THE MOLECULAR STRUCTURES, VIBRATIONAL SPECTROSCOPIES (FT—IR AND RAMAN) AND QUANTUM CHEMICAL CALCULATIONS OF n-ALKYLTRIMETHYLAMMONIUM BROMIDES
© 2013 г. Halil Gokce*, Semiha Bahçeli**
*Vocational High School of Health Services, Giresun University, 28200, Giresun, TURKEY **Physics Department, Faculty of Arts and Sciences, Suleyman Demirel University, 32260, Isparta, TURKEY
E-mail: semihabahceli@sdu.edu.tr Received January 17, 2013
The FT—IR and micro—Raman spectra of three n-alkyltrimethylammonium bromides (dodecyltrimethy-lammonium bromide (DTAB), tetradecyltrimethylammonium bromide (TTAB) and hexadecyl(cetyl)trime-thylammonium bromide (CTAB)) in powder form were recorded in the regions 4000—550 cm-1 and 3200— 300 cm—1, respectively. The optimized geometries and vibrational frequencies of DTAB, TTAB and CTAB have been carried out with ab initio Hartree—Fock (HF) and density functional theory method B3LYP calculations with the 6—31G(d,p) basis set in the ground state. The comparison of the observed fundamental vibrational frequencies and calculated results for the fundamental vibrational frequencies of DTAB, TTAB and CTAB indicate that the scaled B3LYP method is superior compared to the scaled HF method.
DOI: 10.7868/S003040341311007X
INTRODUCTION
The n-alkyltrimethylammonium bromides (where n refers to the number of carbon atoms in the alkyl group) in powder form, called cationic surfactants,
can be used in a medium with dilute aqueous solution as surfactant molecules which are amphiphiles [1]. In recent years the aggregation behavior of surfactant molecules has received enormous interest in science
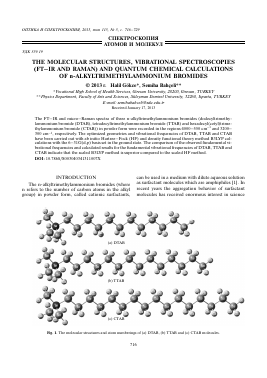
Fig. 1. The molecular structures and atom numberings of (a) DTAB, (b) TTAB and (c) CTAB molecules.
Table 1. The experimental and calculated bond lengths of DTAB, TTAB and CTAB molecules
DTAB TTAB CTAB
Bond lengths, A X-Ray3 HF B3LYP Bond lengths, A X-Rayb HF B3LYP Bond lengths, A X-Rayc HF B3LYP
N1-C2 1.513 1.501 1.517 N1-C2 1.508(2) 1.501 1.518 N1-C2 1.503(7) 1.501 1.518
N1-C14 1.503 1.499 1.512 N1-C16 1.493(3) 1.499 1.512 N1-C18 1.511(7) 1.501 1.514
N1-C15 1.503 1.499 1.512 N1-C17 1.495(3) 1.499 1.512 N1-C19 1.497(7) 1.499 1.512
N1-C16 1.501 1.501 1.514 N1-C18 1.499(2) 1.501 1.514 N1-C20 1.483(7) 1.499 1.512
C2-C3 1.511 1.526 1.527 C2-C3 - 1.526 1.527 C2-C3 1.531(7) 1.526 1.527
C3-C4 1.519 1.533 1.539 C3-C4 - 1.533 1.538 C3-C4 1.523(8) 1.533 1.538
C4-C5 1.484 1.530 1.534 C4-C5 - 1.530 1.534 C4-C5 1.533(7) 1.530 1.534
C5-C6 1.508 1.529 1.533 C5-C6 - 1.529 1.534 C5-C6 1.507(8) 1.529 1.534
C6-C7 1.466 1.530 1.534 C6-C7 - 1.530 1.534 C6-C7 1.510(7) 1.530 1.534
C7-C8 1.516 1.529 1.533 C7-C8 - 1.529 1.534 C7-C8 1.519(8) 1.529 1.534
C8-C9 1.459 1.530 1.534 C8-C9 - 1.530 1.534 C8-C9 1.535(8) 1.530 1.534
C9-C10 1.495 1.530 1.533 C9-C10 - 1.530 1.534 C9-C10 1.519(8) 1.530 1.534
C10-C11 1.429 1.529 1.534 C10-C11 - 1.530 1.534 C10-C11 1.524(8) 1.530 1.534
C11-C12 1.518 1.529 1.534 C11-C12 - 1.530 1.534 C11-C12 1.512(8) 1.530 1.534
C12-C13 1.454 1.528 1.532 C12-C13 - 1.529 1.533 C12-C13 1.526(8) 1.530 1.534
C-C (average) 1.487 1.529 1.533 C13-C14 - 1.529 1.534 C13-C14 1.512(8) 1.530 1.534
C14-C15 - 1.528 1.532 C14-C15 1.522(8) 1.529 1.533
C-C (average) 1.513(5) 1.529 1.533 C15-C16 C16-C17 C-C (average) 1.530(8) 1.539(8) 1.523 1.529 1.528 1.526 1.534 1.531 1.534
a Taken from [21]. b Taken from [22]. c Taken from [23].
and technology, such as detergency, lubrication, demulsification systems for petroleum, water insoluble dyes, nanoscale materials, etc. [2—9].
On the other hand, the vibrational characters of aggregation phenomena for the surfactant molecules were analyzed with spectroscopic techniques like FT-IR and Raman spectroscopies [10—15]. However, although the experimental studies on the mentioned molecules are rather tedious and expensive there is another alternative way which is to employ the computational approaches in order to understand their dynamical behaviour. Ab initio Hartree—Fock (HF), density functional theory (DFT) and Moller—Plessent perturbation theory (MP) methods which are electronic structure methods or quantum chemical methods have been widely used to predict the molecular structure,
spectroscopic properties (IR, Raman, NMR, UV spectroscopic parameters), thermodynamic properties and electronic properties of polyatomic molecules. The quantum chemical computational methods provides support for experimental structural and spectroscopic studies. Therefore, molecular geometry and vibrational spectra of molecules have been studied by using ab initio HF and DFT methods. The advantage of the use of calculation methods is that all vibrational peaks can be considered even if they are unobserved experimentally.
At the present study we report the optimized molecular geometries and vibrational frequencies of three different n-alkyltrimethylammonium bromides, including dodecyltrimethylammonium bromide (DTAB), tetradecyltrimethylammonium bromide
Table 2. The experimental and calculated bond angles of DTAB, TTAB and CTAB molecules
DTAB TTAB CTAB
Bond angles, X-Raya HF B3LYP Bond angles, (°) X-Rayb HF B3LYP Bond angles, (°) X-Rayc HF B3LYP
C2-N1-C14 111.2 111.7 111.6 C2-N1-C16 111.68(17) 111.70 111.66 C2-N1-C18 106.3(4) 108.0 108.3
C2-N1-C15 111.2 111.7 111.6 C2-N1-C17 111.53(17) 111.70 111.66 C2-N1-C19 111.0(4) 111.7 111.7
C2-N1-C16 106.6 108.0 108.4 C2-N1-C18 106.35(15) 108.01 108.33 C2-N1-C20 112.5(4) 111.7 111.7
C14-N1-C15 110.3 109.0 108.9 C16-N1-C17 109.41(17) 109.04 108.93 C18-N1-C19 108.9(4) 108.1 108.1
C14-N1-C16 108.7 108.1 108.1 C16-N1-C18 108.94(17) 108.13 108.07 C18-N1-C20 108.6(4) 108.1 108.1
C15-N1-C16 108.7 108.1 108.1 C17-N1-C18 108.83(17) 108.13 108.07 C19-N1-C20 109.5(4) 109.0 108.9
N1-C2-C3 116.5 116.9 116.7 N1-C2-C3 116.71(17) 116.85 116.77 N1-C2-C3 115.9(4) 116.9 116.8
C2-C3-C4 110.3 110.3 110.7 C2-C3-C4 - 110.25 110.56 C2-C3-C4 107.5(4) 110.3 110.6
C3-C4-C5 116.5 112.6 112.8 C3-C4-C5 - 112.63 112.87 C3-C4-C5 114.5(5) 112.6 112.9
C4-C5-C6 117.4 113.3 113.3 C4-C5-C6 - 113.03 113.26 C4-C5-C6 113.5(5) 113.0 113.3
C5-C6-C7 117.2 113.2 113.4 C5-C6-C7 - 113.15 113.41 C5-C6-C7 114.9(5) 113.2 113.4
C6-C7-C8 116.3 113.2 113.5 C6-C7-C8 - 113.23 113.49 C6-C7-C8 114.1(5) 113.2 113.5
C7-C8-C9 118.6 113.3 113.6 C7-C8-C9 - 113.27 113.53 C7-C8-C9 113.6(5) 113.3 113.5
C8-C9-C10 119.6 113.3 113.5 C8-C9-C10 - 113.29 113.56 C8-C9-C10 113.0(5) 113.3 113.6
C9-C10-C11 119.5 113.3 113.6 C9-C10-C11 - 113.31 113.57 C9-C10-C11 113.4(5) 113.3 113.6
C10-C11-C12 119.0 113.4 113.6 C10-C11-C12 - 113.32 113.59 C10-C11-C12 114.1(5) 113.3 113.6
C11-C12-C13 119.5 113.1 113.3 C11-C12-C13 - 113.33 113.61 C11-C12-C13 114.0(5) 113.3 113.6
C-C-C (average) 117.4 112.9 113.1 C12-C13-C14 - 113.37 113.63 C12-C13-C14 114.2(5) 113.3 113.6
C13-C14-C15 - 113.08 113.27 C13-C14-C15 113.3(5) 113.3 113.6
C-C-C (average) 113.80(5) 112.99 113.19 C14-C15-C16 C15-C16-C17 C-C-C (average) 113.2(5) 111.4(5) 113.2 113.4 113.1 113.0 113.6 113.3 113.3
a Taken from [21]. b Taken from [22]. c Taken from [23].
94 90 86 82 78 74 70
3600
2800
2000
1600
1200
800
Wavenumber, cm 1
Fig. 2. FT—IR spectra of (a) DTAB (b) TTAB and (c) CTAB molecules.
(TTAB) and hexadecyl(cetyl)trimethylammonium bromide (CTAB) as pure solids were calculated by using ab initio Hartree—Fock (HF) calculations and density functional theory DFT/B3LYP method with the 6—31G(d,p) basis in the ground state for the first time.
EXPERIMENTAL
All three n-alkyltrimethylammonium bromides (DTAB, TTAB and CTAB) used in this study were obtained from commercial source (Sigma-Aldrich) and were used without further purification. The prepared
(a) DTAB
3200 3000 2500
(b) TTAB
2000
1500
1000
500 300
a
3200 3000 2500 (c) CTAB
2000
1500
1000
500 300
3200 3000 2500
2000
1500
1000
500 300
Wavenumber, cm 1
Fig. 3. Micro—Raman spectra of (a) DTAB (b) TTAB and (c) CTAB molecules.
samples were compressed to self-supporting pellet and introduced into an IR cell, equipped with KBr windows. The FT-IR spectra of DTAB, TTAB and CTAB were recorded on a Perkin-Elmer Spectrum One FT-IR spectrometer at room temperature in the re-
gion 550—4000 cm-1 with a resolution of 4 cm-1 in transmission mode. On the other hand, the micro-Raman spectra of DTAB, TTAB and CTAB molecules were taken with a Jasco NRS-3100 Laser Raman Spectrophotometer (1800 lines/mm grating and high
Table 3. The comparison of experimental and calculated vibrational frequencies of DTAB molecule
Sym. Assignments Experimental frequencies, cm-1 HF B3LYP/6-31G(d,p)
IR Raman Freq. Iir e ^Raman Freq. Iir e Raman
A' T (CH3) - 324 w 321 0.001 1.045 330 0.181 2.426
A" T (CH3) - 339 w 322 0.087 2.088 332 0.001 1.319
A" T (CH3) + p(CH2) - 373 m 368 0.120 0.386 375 0.649 1.359
A" p (CH2) + p(CH3) + 5(CNC) - 421 m 437 0.412 0.345 437 0.420 0.644
A' 5 (CCC) + S(CNC) - 451 vs 454 0.061 0.830 453 0.019 0.982
A' 5 (CCC) + 5(CNC) - 492 m 479 1.470 0.454 481 2.036 0.450
A' 5 (CCC) + 5(CNC) + p(CH3) 562 m 515 m 503 0.447 0.140 503 0.460 0.109
A' 5 (CNC) + w(CH2) 574 m 534 w 527 5.408 1.133 531 10.042 1.893
A" p (CH2) 690 vw - 700 3.266 0.010 708 4.508 0.011
A" p (CH2) 720 s - 706 1.873 0.001 712 2.902 0.014
A" p (CH2) 729 m - 717 0.230 0.057 722 0.224 0.046
A" p (CH2) 758 w 761 vs 740 1.293 0.023 742 1.496 0.002
A" p (CH2) 770 m - 774 0.327 0.237 774 0.127 0.190
A" p (CH2) + t(CH2) 802 m 802 m 821 1.786 0.072 817 1.612 0.046
A" p (CH3) 843 m 843 w 864 1.234 8.677 867 1.137 1.075
A' v (CN) + p(CH3) 892 w 888 m 906 55.682 4.164 889 48.701 5.034
A" v (CN) + p(CH2) 910 vs 909 w 919 13.331 2.225 903 9.155 2.798
A' v (CC) + v(CN) 936 s 936 m 954 9.426 0.901 954 4.466 1.330
A' v (CC) 962 vs 960 s 961 9.195 2.419 960 1.192 0.602
A' v (CC) 985 m 988 w 985 1.356 0.0836 986 7.256 1.501
A' v (CC) 996 w - 1002 13.533 2.225 1000 3.393 1.6
Для дальнейшего прочтения статьи необходимо приобрести полный текст. Статьи высылаются в формате PDF на указанную при оплате почту. Время доставки составляет менее 10 минут. Стоимость одной статьи — 150 рублей.