Материалы гляциологических исследований, вып. 102
Variations of the Glacier No.1 at the source of the Urumqi River, Tien Shan Mts.,
China, during the past 40 years
Wang Ninglian1'2, Jing Zhefan1, Jiao Keqin1, V. Mikhalenko3, Li Zhongqin1, Han Tianding1, Yang Huian1
1Cold and Arid regions Environmental and Engineering Research Institute, Chinese Academy of Science, Lanzhou, China; 2Tibetan Plateau Research Institute, Chinese Academy of Science, Beijing, China; ^Institute of Geography, Russian Academy of Sciences, Moscow, Russia
Статья поступила в редакцию 20 мая 2004 г. Представлена членом редколлегии А.Ф.Глазовским
Рассмотрена эволюция и баланс массы ледника №1 в Восточном Тянь-Шане за 1959-2002 гг.
Introduction
Mountain glaciers are sensitive to climate change. Their variations in the past can tell us the history of climate variability. Based on the records of worldwide glacier fluctuations, it was estimated that the globe was 0.66 °C warming during the last 100 years [13]. Most studies have shown that the melt of mountain glaciers contributed a substantial fraction of sea level rise in the past century [5, 11, 27], especially in the past decade [2, 14]. In some arid regions, especially in the central Asia, mountain glaciers are important water resources. A study pointed out that glacial melt water accounted for about 40% of the annual runoff in the Tarim basin [23]. However glacier monitoring is an important basis for all these study. At present, there are only about 40 glaciers worldwide with continuous conventional measurements (including mass balance measurement, terminus measurement, etc.) spanning more than 20 years [6]. In China, the Glacier No.1 (43.05°N, 86.49°E, 1.708 km2 in the year 2001, 2.2 km long, 4486 m a.s.l. at the summit, 3736 m a.s.l. at the terminus) at the source of the Urumqi River, Tien Shan Mts., is the only one glacier with continuous measurements for more than 40 years. In this paper, we will report the observation results on this glacier in the past 40 years, and analyze the reasons that lead this glacier fluctuation.
Observations
In 1959, Chinese Academy of Sciences and Xinjiang Water Conservancy Bureau established a glaciological station in Tien Shan Mts., and began to study mass balance, terminus variation, ice formation zone, snow/firn densifi-cation, ice movement, ice temperature, heat budget, glacio-hydrometeorology, etc., on the Glacier No.1. Since 1961, the Tien Shan Glaciological Station has been conducted by Chinese Academy of Sciences. Unfortunately, the measurements on this glacier were interrupted in 1967. The conventional observations were resumed in 1979. And several hydrometeorological/mete-orological stations were also established at the source of the Urumqi River. One hydrometeorological station (43.01°N, 87.25°E, 3693 m a.s.l., called Glacier No.1
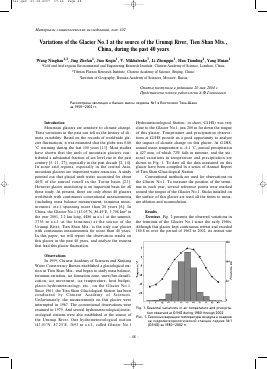
Hydrometeorological Station, in short, G1HS) was very close to the Glacier No.1, just 200 m far down the tongue of this glacier. Temperature and precipitation observations at G1HS provide us a good opportunity to analyze the impact of climate change on this glacier. At G1HS, annual mean temperature is -6.1 °C, annual precipitation is 427 mm, of which 72% falls in summer, and the seasonal variations in temperature and precipitation are shown in Fig. 1. To date all the data measured on this glacier have been compiled in a series of Annual Report of Tien Shan Glaciological Station.
Conventional methods are used for observations on the Glacier No.1. To measure the position of the terminus in each year, several reference points were marked around the tongue of the Glacier No.1. Sticks installed on the surface of this glacier are used all the times to measure ablation and accumulation.
Results
Terminus. Fig. 2 presents the observed variations in the terminus of the Glacier No.1 since the early 1960s. Although this glacier kept continuous retreat and receded 180.8 m over the period of 1962 to 2002, its retreat rate
Fig. 1. Seasonal variations in air temperature and precipitation observed at G1HS during 1980 through 2002 Рис. 1. Сезонные вариации температуры воздуха и осадков на гидрометеорологической станции ледник №1 (G1HS) за 1980-2002 гг.
48
Fig. 2. Terminus variations of the Glacier No.1 at the source of the Urumqi River, Tien Shan Mts., in the past 40 years. Solid line with solid circles is the cumulative retreat amount, and step line for the retreat rate Рис. 2. Положение фронта ледника №1 за последние 40 лет. Кумулятивное отступание ледника показано сплошной линией с кругами; ломаная линия характеризует скорость отступания
varied with time. The retreat rate decreased from the early 1960s to the early 1980s while increased from the early 1980s to present.
Area. The maps of the Glacier No.1 were made at different times during 1962 through 2001 [4, 9, 22, 24]. These maps are very useful to investigate the changes in area of this glacier. We compile the areal extents of the Glacier No.1 at different times in Fig. 3, and present the changes in area in Fig. 4. The Glacier No.1 shrunk 0.242 km2 over the period of 1962 to 2001, i.e. its area decreased by 12.4%. However, a rapid shrinkage occurred
I960
1970
1980
1990
2000
Fig. 3. Sketch map of the boundaries of the Glacier No.1 at
the different times in the past 40 years Рис. 3. Положение границ ледника №1 за последние 40 лет
Fig. 4. Area changes of the Glacier No.1 in the past 40 years Рис. 4. Изменение площади ледника №1 за последние 40 лет
during 1992 to 1994. This might be related with the fact that the Glacier No.1 separated completely into two small glaciers/branches, east and west glaciers/branches, in 1993. The separation could make a large ice-free area in the previous conjunction between those two branches.
Mass Balance. Although the measurements on the Glacier No.1 were interrupted during 1967 through 1979, the values of mass balance in this interval were estimated using the correlation between the mass balance and climatic data observed at Daxigou station (43.01°N, 86.83°E, 3534.8 m a.s.l.) [25, 26]. Fig. 5 a displays the variations in mass balance of the Glacier No.1 in the past 40 years. It clearly indicates an increase trend of ice volume loss. Over the period of 1958/1959 to 2001/2002, the cumulative mass balance was -9670 mm water equivalent (w. e.), equivalent to an ice volume loss of 1.93x10⁷ m3. Based on the observed and interpolated data series, we found that about 90% of the total ice volume loss occurred in the period of 1979/1980 to 2001/2002, and about 44% of the total ice volume loss occurred just in recent 6 years (1996/1997 to 2001/2002). Recent accelerated ice volume loss should be responsible for recent accelerated retreat in terminus and rapid shrinkage in area.
Equilibrium Line Altitude (ELA). Fig. 5 b illustrates variations in ELA of the Glacier No.1 in the past 40 years. The mean ELA was 4056 m a.s.l. over the period of 1958/1959 to 2001/2002. Although the ELA showed large fluctuations, it had a general increase trend. If fitted a linear trend to the observed data, the ELA rose about 45 m over that entire period.
Discussion
The critical link between glaciers and climate is glacier mass balance [12]. To further detect the mass balance trend of the Glacier No.1 in the past 40 years, the cumulative sum of the mass balance departures from -129 mm w.e./yr, the mean mass balance over the 30-year climatological reference period 1961—1990, are calculated and presented in Fig. 6. It can be seen clearly that the trend of the mass balance shows a shift in the late 1970s, i.e. the mass balance of this glacier has changed toward a significant deceasing trend since then, and further acceleration since the early
49 -
Материалы гляциологических исследований, вып. 102 600 400 i 200 ! о
о
2 -200
4150
4100
4000
3950
3900
Fig. 5. Mass balance variations (a) and ELA variations (b) of the Glacier No.1 in the past 40 years: 1 — the observation data, 2 — the interpolation values estimated by [25, 26] using the correlation between the observed mass balance and ELA with meteorological data Рис. 5. Баланс массы (а) и колебания высоты границы питания (ELA) (b) ледника №1 за последние 40 лет:
1 — результаты непосредственных измерений,
2 — значения, реконструированные по связи баланса (а) и (ELA) (b) с метеорологическими параметрами [25, 26]
1990s. This is very similar to the global trend of the glacier volume loss (see Fig. 4 in [7]).
We know mass balance value in a balance year is mostly controlled by the climatic conditions in that same balance year. So we analyze the correlation between climatic factors (only temperature and precipitation are
Fig. 6. Cumulative departures of the Glacier No.1 mass balance relative to its mean in 1961 — 1990 "climatological normal" period
Рис. 6. Отклонения кумулятивного баланса массы ледника №1 от среднего за 1961 — 1990 г. значения
considered here) observed at G1HS and the mass balance values measured on the Glacier No.1 to realize major cause of this glacier variation. Table 1 shows the correlation coefficients between the annual mass balance and precipitation in the different periods of the balance year. No significant correlation exists there. This implies that precipitation might not be a major factor influencing the behavior of the Glacier No.1. However, the annual mass balance is strongly correlated with summer mean air temperature (see Table 1). From the Fig. 1, it can be seen that only June, July and August temperatures are positive, and July temperature is the highest in the year. So if summer mean temperature is calculated by assigning weights of 0.25, 0.5 and 0.25 to June, July and August temperatures, respectively, the correlation coefficient between the annual mass balance and summer mean temperature can reach -0.721. This means that summer temperature is the major cause of the variations in the mass balance. For that the ELA of the Glacier No.1 is highly correlated with its
Для дальнейшего прочтения статьи необходимо приобрести полный текст. Статьи высылаются в формате PDF на указанную при оплате почту. Время доставки составляет менее 10 минут. Стоимость одной статьи — 150 рублей.