ОПТИКА И СПЕКТРОСКОПИЯ, 2014, том 117, № 5, с. 724-730
СТЕКТРОСКОПИЯ ^^^^^^^^^^^^^^ АТОМОВ И МОЛЕКУЛ
УДК 543.421
ABSORPTION AND QUANTITATIVE CHARACTERISTICS OF C-H BOND
AND O-H BOND OF NIR
© 2014 г. Zhisheng Wu, Guoqing Ouyang, Xinyuan Shi, Qun Ma, Guang Wan, and Yanjiang Qiao
Beijing University of Chinese Medicine, 100102 China Key Laboratory of TCM-information Engineering of State Administration of TCM, Beijing, 100102 China Beijing Key Laboratory for Basic and Development Research on Chinese Medicine, Beijing, 100102 China
E-mail:yjqiao@263.net; wzs@bucm.edu.cn Received April 24, 2013; in final form, November 11, 2013
The previous study mainly focused on the interpretation of the relationship between absorption characteristics and quantitative contribution in each near-infrared (NIR) frequency range. Furthermore, the absorption characteristics of NIR mainly cover overtones and combinations of molecular vibrations such as CH, OH, SH and NH bonds. And it has been know that NIR wavelengths of C-H bond and O-H bond are assigned to different radio frequencies. This paper was intended to investigate the absorption characteristics of bond C-H and O-H bonds in NIR spectral range. Water and acetone which correspond to O-H and C-H bonds have been selected as typical solvents, as well as solutes. Calibration models were established using partial least square regression (PLS) and multiple linear regression (MLR). The parameters of the model were optimized by different spectral pretreatment methods. The result showed that the model set by Savitzky-Golay smooth (SG) in the spectral region of 810—1100 nm could successfully make accurate predictions. Short wave-NIR region has been discovered as optimum characteristic absorption of C-H and O-H bonds.
DOI: 10.7868/S0030403414110233
1. INTRODUCTION
Near-infrared (NIR) spectroscopy has been widely used as a fast, low cost and non-destructive technique. The wavenumber of NIR is from 4000 to 12500 cm-1, which mainly covers overtones and combinations of molecular vibrations. These signals decrease significantly in absorption cross section, compared with the fundamental vibrational bands from mid-infrared [1-4]. The functional groups, C-H, N-H, O-H and S-H are almost exclusively involving the hydrogen atom. Based on the molecular vibrations, the NIR frequency range can be divided into four ranges: combination region (CR, 4000-4900 cm-1), first combination-overtone (FCOT, 4900-7100 cm-1), second combination-overtone (SCOT, 7100-10000 cm-1), and third overtone (TO, 10000-12500 cm-1) [5].
Recently, NIR effectiveness for both qualitative and quantitative analysis has proven in different fields such as agriculture, food and petroleum industry [6-8]. However, because of its high detection limit and low sensitivity, the trace analysis of NIR is still a tough challenge. The main difficulty of NIR is overlapping and broad absorption bands due to their overtones and combination tones of hydrogen bonds, thus strong self-absorption of the solvent may seriously interfere with the absorption signal of the solute [9-11].
NIR wavelengths of C-H bond and O-H bond are assigned to different radio frequencies[12, 13]. On the other hand, a great majority of solvents contain C-H
bond and O-H bond system. Therefore, we tried to research the absorption and quantitative characteristics of C-H bond and O-H bond of NIR, finding the features of their absorption intension and the diversity of the usefUl message leading by the concentration of the samples.
In our experiment, water and acetone, which correspond to O-H bond and C-H bond, were selected as typical solvents, as well as solutes (water in acetone and acetone in water). Then calibration models were established by different methods using partial least square regression (PLS) and multiple linear regression (MLR). The model fitting results can generally be evaluated according to the following chemometric indications: low root mean square error in cross-validation (RMSECV), low root mean square prediction error (RMSEP), high determination coefficient (R2) and low bias, etc. [14—16].
Once the calibration model is developed, favorable predictions could be expected. Then the optimum wavelength will be investigated for the absorption signal of C-H bond and O-H bond of NIR.
2. MATERIALS AND METHODS 2.1. Materials
Acetone was purchased from Concord Technology Co., Ltd. (Tianjin, China), Deionized water was purified by Milli-Q water system (Millipore Corp., Bedford, MA, USA).
<D O
S
£ 4
O
ca %
- (a) ^. 'i'l1 '
- r\ ,
\ r
- \J
i i i i i
3 2 1
J-0
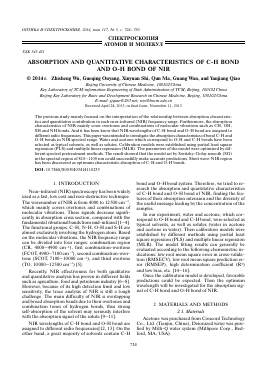
400 800 1200 1600 2000 2400 400 800 1200 1600 2000 2400
Wavelength, nm
Fig. 1. Raw NIR spectra of acetone (a) and water (b) sample solutions.
2.2. Preparation of Sample Solutions
1.0 mL acetone was measured to a 10 mL volumetric flask accurately. And then meter the volume to scale with water to dispense the 10% acetone solution in water. 5.0 mL of the solution was transferred to a 250 mL volumetric flask and diluted with water to dispense the 0.2% acetone solution. Measure 0.1, 0.2, 0.3—2.3, 2.4 and 2.5 mL of the 0.2% acetone solution to a 5 mL volumetric-flask separately, then meter the volume to scale with water to dispense the 40, 80, 120—920, 960 and 1000 ppm acetone solutions.
Measure 125.0 mL of the 0.2% acetone solution to a 250 mL volumetric flask and then meter the volume to scale with water to dispense the 0.1% acetone solution. Measure 0.1, 0.3, 0.5-4.5, 4.7 and 4.9 mL of the 0.1% acetone solution to a 5 mL volumetric flask separately, then meter the volume to scale with water to dispense the 20, 60, 100-900, 940 and 980 ppm acetone solutions.
The same method was used to prepare water solutions in acetone of the same concentration series. Then all the sample solutions (about 1 mL) were hold in circular sample cuvettes with solid caps separately (8 mm in diameter) for NIR spectra collection.
2.3. NIR Equipment and Software
The NIR spectra were collected in the transmission mode using the XDS rapid liquid analyzer with VISION software (Foss Holographic Grating NIR System, Silver Spring, MD, USA). Each spectrum was in average of 32 scans with a wavelength increment of 0.5 nm. The range of spectra was from 400 to 2500 nm. Each sample was analyzed three times and the mean of the three spectra was used in the following analysis.
2.4. Calibration Model
Spectral data were selected under the concentrations of 20, 40, 80, 100, 140, 160-860, 880, 920, 940,
980, 1000 ppm (about two thirds of all samples) to set calibration model in pertinent method and the rest for prediction. In this work, two calibration models were set: PLS model and MLR model. The PLS model was evaluated by parameters such as determination coefficient of calibration (Rc), determination coefficient of prediction (Rp), prediction residual error sum of squares (PRESS), root mean square error of calibration (RMSEC), RMSECV, RMSEP, residual predictive deviation (RPD). The MLR model was evaluated
by the parameters like R2, Rp, RMSEC, RMSEP and RPD.
Data analysis was performed with home-made routines programmed in MATLAB code (MATLAB v 7.0, MathWorks) and VISION software.
3. RESULTS AND DISCUSSION 3.1. NIR Spectral Characteristics
Figure 1 shows the raw NIR spectra of sample solutions. As shown in Fig. 1, there was too much noise in the CR region, which was interfered with the quantitative analysis of the solutes. On the other hand, there were large signal fluctuations in the spectral region of 800-1900 nm, which might mean that this spectral region contained the main information which could reflect the concentration message of different samples. As a consequence, the spectral region of 800-1900 nm was selected for model setting, in order to set a reasonable model which could make accurate quantitative prediction.
3.2. Comparison of Different Spectral Pretreatment Methods
The type of data pre-processing technique prior to the development of calibration model may greatly influence model performance. Table 1 shows the
5
4
6
2
726 ZHISHENG WU et al.
Table 1. Comparison of PLS models using different spectral pretreatment methods
Solvents Pretreated method Factor RMSEC RMSECV PRESS RMSEP RPD
Acetone Raw 6 0.9244 85.01 89.73 700524.94 0.9274 103.72 2.81
1D 7 0.8669 113.49 120.53 1263860.6 0.8680 138.95 2.10
2D 3 0.5481 204.02 209.57 3820944.5 0.7311 192.55 1.51
SG 12 0.9663 46.37 57.38 121539.57 0.9577 75.13 3.88
NPS 7 0.9048 95.97 103.86 938462.94 0.9101 115.24 2.53
BC&NPS 8 0.9121 92.82 100.73 882677.69 0.9194 109.82 2.65
BC&NPS&SG 4 0.8928 99.97 107.20 999703.13 0.8911 127.53 2.29
Water Raw 2 0.2037 259.33 264.18 6490401.5 0.3125 300.50 0.97
1D 2 0.1724 264.38 273.59 6961432.0 0.0975 309.51 0.94
2D 6 0.7383 152.09 159.38 2362369.2 0.8009 173.90 1.68
SG 4 0.9687 58.03 72.95 368520.19 0.9754 72.40 4.03
NPS 2 0.2041 259.27 263.94 6478759.0 0.3032 304.36 0.96
BC&NPS 2 0.1925 261.14 265.89 6574750.5 0.3199 269.74 1.08
BC&NPSSSG 10 0.9616 60.78 100.06 715815.31 0.9505 91.35 3.19
comparison of different spectral pretreatment, i.e. 1st order derivative (1D), 2nd order derivative (2D), Savitzky-Golay smoothing (SG), N-Point Smoothing (NPS), Baseline Correction + N-Point Smoothing (BC&NPS), Baseline Correction + N-Point Smoothing + Savitzky-Golay smoothing (BC&NPS&SG). To our basic knowledge, the nearer 2 2
the value of R and Rp come to 1, the better the line of calibration and prediction result could be; the lower the value of RMSEC, RMSECVand RMSECP is, the more accurate the calibration model and prediction could be. As to the RPD, it is equal to the value of SD (mean square deviation) being dividing by RMSEP, with the use of evaluating the model's ability of predictions, the bigger the value of RPD is, the higher prediction ability the model has, and when it is bigger than three, it means that the model can predict accurately [17].
As shown in Table 1, the values of the R
Для дальнейшего прочтения статьи необходимо приобрести полный текст. Статьи высылаются в формате PDF на указанную при оплате почту. Время доставки составляет менее 10 минут. Стоимость одной статьи — 150 рублей.