ОПТИКА И СПЕКТРОСКОПИЯ, 2015, том 118, № 1, с. 135-138
СПЕКТРОСКОПИЯ КОНДЕНСИРОВАННОГО СОСТОЯНИЯ
УДК 543.42
PECULIAR EFFECTS ACCOMPANYING THE PRODUCTION OF WHITE LIGHT BY IR EXCITED NANOPARTICLES
© 2015 г. G. Bilir*, **, G. Ozen*, and B. Di Bartolo**
*Department of Physics, Istanbul Technical University, Istanbul, TURKEY **Department of Physics, Boston College, Chestnut Hill, MA, USA E-mail: bilir@bc.edu Received April 24, 2014
We report some unexpected occurrences that have accompanied our recent discovery of white light emission from infrared light excited doped and nominally un-doped oxide nano-powders.
DOI: 10.7868/S0030403415010055
INTRODUCTION
We have recently achieved the production of a broad band (ranging from 400 to 900 nm) white light (WL) following the monochromatic infrared light (803.5 and 975 nm) excitation of both nominally un-doped and rare earth and transition metal ions-doped oxide nano-powders. Experimental results indicate that such emission feature is a nano-scale phenomenon [1, 2], cannot be ascribed to an overlap of sharp emission bands in the un-doped case and, even if assisted by the dopant presence, is a host matrix-related process.
The spectral distribution of the detected WL resembles very closely that of an incandescent lamp, which in turn is still unmatched with respect to its color quality, mimicking the sunlight, the most comfortable light to human eyes. We have demonstrated the possibility to obtain WL with very high efficiency and CRI approaching the theoretical limit with an alternative approach. Our experimental results make our WL emission very interesting at both the fundamental and the applicative level and may open the way to an alternative route with respect to incandescent lamps.
The band produced by the different compounds occupies similar regions of the spectrum. The characterization of the various samples had to rely on parameters more sensitive to particular situations, such as patterns of decay and of rise in intensity.
We shall recount briefly the conditions of the experiments and summarize the results and then we shall focus our attention on the peculiar aspects of some of our results.
EXPERIMENTAL
The samples used in this work with the information about synthesis procedure and the average particle sizes are summarized in Table. The details about synthe-
sis procedure and structural characterization were described elsewhere[2—7].
The continuous emission WL spectra were produced by pumping the samples with the output of a Laser Drive Inc. Model LDI-820 laser diode operating at 803.5 nm with the maximum output power of 3 W or of a similar diode operating at 975 nm with the maximum output of 10 W. The signal was directed toward the entrance slit of a 1 m McPherson Model 2051 monochromator and chopped at a frequency of 250 Hz before entering the slit. The monochromator provided a resolution 0.8 A with the slits set at 50 ^m and a wavelength reproducibility of 0.1 A. The optical signal was detected by Hamamatsu R1387 photomul-tiplier tube with an S20 response, sent to a EG&G Model 5210 lock-in amplifier and recorded in a computer.
The rise pattern and the decay pattern of the WL were measured by using a shutter that allowed the light to reach its full intensity and then cut sharply the pumping power. We used a 850 nm cut-on long pass filter to avoid second harmonic contribution of the short wavelength values.
The samples studied, synthesizing procedure, average particle sizes
Sample Synthesizing procedure Mean particle size, nm
Y2O3 thermal decomposition [3—5] 25
AI2O3 purchased from Sigma Aldrich <50
YAG chemical coprecipitation [6] 55
GGG-Cr Pechini method [7] 78
13 <D
13 £ o £
A/jf YtvJ
/ / \
1/2 / > ,1
/ // I
/ jy
J 1 1 V-
500 600 700 800 900
Wavelemgth, nm
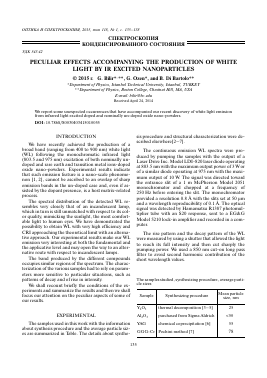
Fig. 1. WL spectrum of all samples (the spikes in the spectrum are due to spurious modes in the laser diode emission): Xexc = 803.5 nm (1 - Y2O3, 2 - YAG, 3 - GGG—Cr), Xexc = 975 nm (4 - Al2O3). T = 300 K, P = 0.02 mbar.
EXPERIMENTAL RESULTS
Table reports the average particle sizes estimated by using XRD patterns and confirmed by SEM measurements.
Figure 1 shows the obtained WL spectra collected in the 400—900 nm wavelength range for the Y2O3, Al2O3, YAG, and GGG samples, respectively. The spectra are similar in their general aspects.
We shall summarize the experimental results that we obtained by characterizing a representative system, the Y2O3 un-doped system which emits WL when excited by either 803.5 or 975 nm infrared laser light.
The WL emitted under these two conditions occupies similar regions of the spectrum. We shall briefly mention the results of the characterization.
1. Since no WL emission was observed by bulk samples of Nd-doped Y2O3 exposed to the same exciting infrared laser light as the nano-powder samples, definitely the observed production of WL can be considered as typical of the nano-scale regime.
2. The spectral distribution of the WL is to a large extent independent on the Nd concentration and even the presence of the Nd dopant. While WL occurrence favors the WL generation but is not necessary to induce such process, the presence of Nd makes easier to
Normalized intensity
Fig. 2. Rise pattern dependence on pumping power in un-doped Y2O3 (803.5 nm excitation, 300 K): 0.61 (1), 1.07 (2), 1.52 (3), 1.96 (4), 2.38 W (5).
Time, seconds
Fig. 3. Rise pattern of un-doped Y2O3 under 975 nm excitation. The inset is the expanded sharp rise of the pattern. T = 300 K, P = 0.02 mbar.
PECULIAR EFFECTS ACCOMPANYING THE PRODUCTION OF WHITE LIGHT
137
Normalized intensity 1
900
Wavelemgth, nm
Fig. 4. The blue shift of the WL spectrum of Y2O3 with time under 975 nm excitation. See text for explanation.
obtain WL emission under low pumping power and higher environment pressure conditions.
3. The temperature of the sample's holder does not influence the spectral shape and seemingly the intensity of the WL emission.
4. The pressure in the sample environment has a great influence on the intensity of the WL. It acts in the opposite sense with respect to the intensity of the exciting infrared light: low pressure favors the emission of WL, and a strong excitation does likewise.
5. The most noticeable aspect of the decay patterns is their deviation from exponentiality. Such behavior could be inferred by the role played by the powders' surfaces, role that becomes more important as the radius of the particle is reduced. Going from the surface to the center of a particle one would encounter a variety of conditions, with each condition determining a different decay patterns. The observed pattern is the superposition of the various different patterns. Accordingly the deviation from an experimental pattern is in general more pronounced in smaller particles.
6. The spectral distribution of the detected WL resembles very closely the one of an incandescent lamp, which is still unmatched with respect to its color quality, since it resembles the sunlight which is the most comfortable for human perception.
The following considerations deal with occurrences that manifest themselves depending on the wavelength of the exciting infrared light.
1. The WL spectrum produced by the 975 nm excitation is not significantly different from that produced by 803.5 nm excitation. The dependence of the WL intensity on the fourth power of the exciting 803.5 nm diode power suggests the multi-photon aspect of the absorption process. In fact, an interpretation of the exponent n occurring in the law I = APn is just in terms
012
Time, seconds
Fig. 5. Representative decay patterns of nominally un-doped Y2O3 measured at different part of the WL spectrum
803.5 nm, T = 300 K, P = 0.02 mbar): XWL = 450,
500, 530, 560, 590, 620, 650, 700, 750, 850, 900, 950, 1000 nm.
of number of photons in multi-photon absorption events. The same can be inferred in the case of the other exciting wavelength (975 nm). However, being a 975 nm photon less energetic than a 803.5 nm photon, more photons are required to induce multi-photon absorption in the un-doped system. This is indeed the case: the WL intensity found to be proportional to a higher exponent n of the power of the exciting 975 nm source.
2. The decay patterns following the 975 nm excitation are not significantly different than those following the 803.5 nm excitation, as one would expect. The different experimental conditions may produce different amount of excitation, but this should have no effect on the enfolding of the spontaneous decay.
PECULIAR OCCURRENCES
The wavelength of the excitation has a greater influence on the rise patterns than on the decay patterns of the Y2O3. This is evident when comparing the two figures (Figs. 2 and 3) that report the rise patterns following the excitation by 803.5 and 975 nm laser lights, respectively.
An interesting feature that emerges when comparing the two figures is that the very first part of the Fig. 3 pattern represented in the insert resembles the rise pattern of Fig. 2.
The spectra that appear in Fig. 4 are an additional illustration of the process presented in Fig. 3. They represent the WL emission of the un-doped Y2O3 nano-powders taken at different times after exposing the sample to the 975 nm laser radiation. The mea-
ОПТИКА И СПЕКТРОСКОПИЯ том 118 № 1 2015
Time, ms 800 -
400
600
800 1000 Wavelength, nm
Fig. 6. 1/e time distribution of all samples as a function of measured wavelength: 1 — Y2O3, 2 — GGG—Cr, 3 — Al2O3, 4 - YAG- Co.
surement of each spectrum took 10 min; it took about an hour for the spectrum to reach its ultimate intensity.
Another peculiar effect regards the decay patterns of the WL. We have examined in detail the decay patterns of the samples listed in Table by looking at them
at different wavelengths. A typical result of our investigation is presented in Fig. 5 where we show the decay pattern of Y2O3 at different wavelengths.
We have taken as a mea
Для дальнейшего прочтения статьи необходимо приобрести полный текст. Статьи высылаются в формате PDF на указанную при оплате почту. Время доставки составляет менее 10 минут. Стоимость одной статьи — 150 рублей.