ОПТИКА И СПЕКТРОСКОПИЯ, 2015, том 118, № 2, с. 261-268
^ СПЕКТРОСКОПИЯ
КОНДЕНСИРОВАННОГО СОСТОЯНИЯ
УДК 548.0:535.34
RECHARGING PROCESSES OF Ce3+ IN GAMMA-IRRADIATED YAG:Ce
SINGLE CRYATSLS
© 2015 г. T. Butaeva*, I. Ghambaryan*, and M. Mkrtchyan**
*Institute for Physical Research, National Academy of Sciences, 0203, Ashtarak-2, Armenia **National Science Laboratory, 0036 Yerevan, Armenia E-mail: tbutaeva@gmail.com Received August 11, 2014
The influence of Y-irradiation on the spectral properties of YAG and YAG:Ce (~0.12 and ~0.2 at %) single crystals is studied. The interrelation between the changes of Y-induced absorption of Ce3+ and of some color centers in the crystals is established. It is shown that the analysis of radiative behavior of Ce3+ in YAG:Ce crystals gives the opportunity: to evaluate a quantity of electron-hole traps influencing on cerium ions in as-grown crystals and involving in radiation processes of cerium ions recharging; to predict the concentration changes of Ce3+ in crystals irradiated by doses (1.13-5.5) x 107 rad of Y-rays. The reasons of the activator ions concentration impact on the various radiation behaviors of Y-induced absorption and optical quality of these crystals are discussed.
DOI: 10.7868/S003040341502004X
INTRODUCTION
Single crystalline bulk Y3A5O12:Ce (YAG:Ce) [1, 2] is a well-established and industrially produced scintillator possessing high light yield (20000-24 000 ph/MeV), moderate decay time (10-120 ns), good energy resolution (~7%) and used for applications in X-ray and low (<300 KeV) energy y-ray detectors [3]. However, high-quality crystals production is conjugated with a range of issues one of which is a definition of quantity and types of charge traps existing in as-grown crystals. Presence of hole (h) and electron (e) traps and of other structural defects in this oxide material is a reason of the occurrence of unwanted absorptions induced by radiation in the range of emission and a formation of additional relaxation channels [4]. Moreover, ability of Ce3+ ions to be easily recharged and ionic radiuses misfit of Ce3+ and Y3+ leads to appearance in these crystals of unstable valence states of the regular activator ions. Formation of (Ce3+ + h) and (Ce4+ + e) centers which can strongly change the efficiency of color centers generation under an influence of radiation (y-, X-rays) in different glasses had been considered in detail in [5, 6]. Occurrence of the same centers in YAG:Ce crystals had been discussed in [7]. Existence of such bound states of cerium ions in the crystals is the reason of origin of y-induced Ce4+ Ce3+ recharging processes which leads to variations in the Ce3+ concentration: increase in final concentration of the activator in YAG:Ce with small initial Ce3+ content and ionization of Ce3+ for the crystals with higher Ce3+ content [8]. Accordingly, the imperfection level of the crystal after irradiation strongly depends not only on
its initial quality and also on the concentration of active dopant [9]. Another type of defects caused by the activator ions is substitution defect, so-called "antisite"
CeAi center observed in garnet [8, 10, 11] and perofskite [12] crystals. It has been noted [11] that existence of
CeA+ in LuAG:Ce (8 and 550 at ppm) can reduce the scintillation efficiency of the crystals and negatively influence on their scintillation characteristics.
Thus, the evaluation of color centers quantity affecting the activator ions in YAG:Ce crystals and influence of Ce3+ concentration on the crystals quality still are important today. Purpose of this work includes: definition of some color centers participating in changes of Ce3+ absorption in y-irradiated YAG:Ce crystals; search of an assessment manner of the quantity of charge traps interacting with the activator ions in as-grown and irradiated crystals; determination of the reasons of opposite behavior of y-induced absorption of Ce3+ in the crystals with different concentration (~0.12 and ~0.2 at %) of the activator ions.
USED MATERIALS AND RESEARCH METHODS
YAG and YAG:Ce single crystals (SC) were grown by the vertical Bridgman method (Laboratory of Luminous Materials, IPR NAS RA). Two groups of crystal plates (0.1 mm thickness) of YAG:Ce (0.12; 0.13; 0.13 at %) and YAG:Ce (0.18; 0.2; 0.22 at %), hereinafter marked as SC1 and SC2 respectively, have been chosen for experimental studies. Volumes relation of the crystal plates of SC1 to SC2 ones was 1.04-1.08.
Absorption coefficient, cm 1 60
50 40 30 20 10
0
(a)
°t 0 .ï
1-0-4
c o
-0.8
g-1'2
200 300 400 500 600 700 Wavelength, nm
200 300 400 500 600 700 800 900
Wavelength, nm
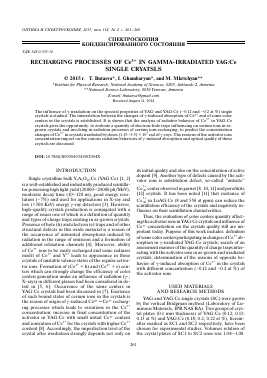
Fig. 1. a — absorption spectra of YAG before (1) and after
(2) y-irradiation, b — y-induced absorption spectra.
Absorption coefficient, cm 80
60
40
20
0^
m50
192 nm
is-
40
30
20
200 220 240 Wavelength, nm
200 300 400 500 600 700 800 900
Wavelength, nm
Fig. 2. Absorption spectra of YAG:Ce (0.12 (1) and 0.20 at % (2)) crystals. Inset: spectral position of the shortwave absorption bands of Ce3+.
1
2
Activator concentration (CCe) in the crystals was estimated by the absorption coefficient magnitudes of Ce3+ [13]. Optical density (D) spectra of the crystals were recorded at room temperature in the range of 189-900 nm by the spectrophotometer "SPECORD M40" and the absorption coefficient k has been deduced considering the sample thickness. Investigated crystals were irradiated by three different doses (Ddos) from y-source of 60Co (photon energy -1.25 MeV) at dose rate of 28 rad/s. The true radiation doses absorbed by the crystals have been calculated [14] by
Dabs = [(1/ p) abs /W P) dos ] Ddos,
where Dabs is the energy dose absorbed by a sample, Ddos is the energy dose absorbed by a dosimetric system, (|/p)dos is the mass absorption coefficient of the dosimeter (0.02950 cm2/g) for the used source, (|/p)abs is the mass energy-absorption coefficient [15] of the sample. For SC1 and SC2, the applied doses of y-radiation, calculated absorbed doses and number of y-photons absorbed by cerium Nabs(Ce) in these crystals are presented in Table 1.
RESULTS AND DISCUSSION Color Centers Absorption in YAG and YAG:Ce
Observed in our measurements the absorption of color centers, formed in YAG and YAG:Ce crystals, are considered in this division.
The absorption spectrum of as-grown YAG crystal (Fig. 1a) shows a presence of significant absorption at <200 nm, intense band at ~210 nm and more weakly band at ~320 nm. A shape and an intensity of the absorption at 190-240 nm as well as some distinctions in
the range 240-330 nm depend on the crystals growing technique and a purity of row materials [16-18].
Gamma irradiation of YAG by dose 2 (Fig. 1a) improves the crystal transmission except the range at 250-320 nm (Fig. 1b). This range corresponds to the absorption of uncontrollable impurity ions of the transition metals such as Fe2, 3+, Cr3+ [8, 9, 16, 19] replacing Al3+ ions in octahedral sites of the crystal. Instead of the broad absorption band at ~210 nm, in y-induced spectra appears a decreased absorption of two bands at 196 and 226 nm associated with F and F+ centers in [20]. The maximal change of y-induced absorption at <190 nm is observed in the range of the crystal's excitons creation [21].
YAG:Ce crystals absorption in UV-visible spectral region are conditioned by the absorption of YAG matrix, 4f 15d0 ^ 4f° 5d1 transitions of Ce3+ and absorption of defects created by cerium ions. These crystals absorption spectra (Fig. 2) clearly exhibit only two bands of Ce3+ at 459 and 340 nm. Overlapping of Ce3+ absorption bands at ~220 nm [18, 22] and, probably, at ~207 nm [23] with the absorption of F+ center (226 nm) is observed at attentive consideration of this range in
Table 1. Applied and absorbed doses of y-rays, number of Y-photons absorbed by cerium ions in YAG:Ce crystals (SC1 and SC2)
Dose, D Ddos x107, rad Dabs x107, rad SC1 Nabs(Ce) x 10-11, y-hotons SC2 Nabs(Ce) x 10-11, y-hotons
1 1.13 0.96 1.45 1.40
2 3.10 2.56 3.92 3.70
3 5.50 4.69 7.41 6.90
с
aj
'о
аз
и с о
с
S? 2
о
сл -С
са
S3 0
Й
о
Dose 1
226 nm
300 nm
(a)
~370 nm
Ce3+ - 0.13 at %
_i_I_I_I_I_I_
226 nm
/ Ce3+ - 0.18 at %
_i_I_I_I_I_I_
200 400 600 800
Dose 2
226 nm
200 400 600 800 Wavelength, nm
Dose 3
300 nm
(c)
226
Ce3+ - 0.13 at %
Ce3+ - 0.22 at %
J_I_I_I_I_I_L_
200 400 600 800
Fig. 3. Y-induced absorption spectra of SC1 (a, b, c) and SC2 (d, e, f). Absorption changes of some color centers are indicated.
inset on Fig. 2. The band at 192 nm which is enough discernible in the crystals with low absorption intensity at <190 nm and can be associated with Ce3+ transitions to the highest energy level located in the range of excitons creation [21, 23, 24].
The presence in YAG:Ce crystals of examined above color centers (or charge traps) which can be sources of electrons or holes for cerium ions is not observed directly in the spectra on Fig. 2. But, such as in YAG crystal, the absorption of these centers arise in Y-induced spectra of YAG:Ce (SC1, SC2) which are presented in the next division.
Gamma-Induced Absorption of YAG: Ce
Figure 3 depicts the spectra of Y-induced absorption of SC1 and SC2.
In comparison with YAG, about 10 times stronger absorption at 240—320 nm are seen in SC1 and, especially, in SC2 (Fig. 3a, d—f). Besides the recharging band of Fe3+ at 240—260 nm [19], this range includes the absorption of T2g triplet of CeAl center at ~ 270-320 nm [11]. Increase of Y-induced absorption at 270-310 nm (Fig. 3a)
can be interpreted by the formation of (CeA+ + e) centers during the crystals irradiation, if to assume that CeAl defects in our crystals are forming in the crystal-
lization process mainly as CeA+ adjacent to hole traps. The related absorption of (CeA+ + e) center, hereinafter denoted as CeAl, have been attributed to the band at ~300 nm located on the long-wave tail of the recharging band of Fe3+. Increase of this band
Для дальнейшего прочтения статьи необходимо приобрести полный текст. Статьи высылаются в формате PDF на указанную при оплате почту. Время доставки составляет менее 10 минут. Стоимость одной статьи — 150 рублей.