ОПТИКА И СПЕКТРОСКОПИЯ, 2015, том 118, № 3, с. 516-519
ГЕОМЕТРИЧЕСКАЯ И ПРИКЛАДНАЯ ОПТИКА
УДК 535.417
STUDY OF THE SPECTRAL FEATURES OF DIFFERENT BIOLOGICAL SAMPLES © 2015 г. M. Atif
Physics and Astronomy Department, College of Science, King Saud University, Riyadh, Saudi Arabia National Institute of Laser and Optronics, Nilore, Islamabad, Pakistan E-mail: atifhull@gmail.com Received October 11, 2013
In the present study we have observed and analysed the fluorescence changes in the fluorescence spectra of four different samples like brilliant sulphaflanine, quinine bisulphate, coumarine 120 and porcine cornea and sclera including the changes in fluorescence spectrum of cornea are also observed after CO2 laser expo-sure.The preliminary study clearly explains the proof of concept only.
DOI: 10.7868/S0030403415030058
1. INTRODUCTION
The aim of this study was to identify the changes in tissue due to laser induced fluorescence. Optical spectroscopy techniques have been used for tissue characterisation and for measurements of various parameters in tissue. The techniques developed for tissue characterisation are called "optical biopsy", a term that is contradictory, since the biopsy means the removal of tissue while the word optical implies that tissue is not removed. The ultimate goal for these investigations is to eliminate the need for surgical removal of tissues. This would reduce the cost and time needed to obtain the diagnostic information. Due to the development of these techniques, an intermediate goal is to decrease the number of biopsies needed by guiding the physician to the suspicious tissue areas.
Fluorescence spectroscopy is one of techniques presently being applied in the medical field [1—8]. It is
important because it provides the detailed knowledge of all the parameters that characterise the fluorescence emission, like spectral features, decay time behaviour and polarisation, imaging whenever the localisation of any marker is required. In medicine, fluorescence imaging has been proposed for the detection of pathologies or specific physiological conditions, both at a research level and as a standard routine, e.g. fluorangiography, detection of tumours [9] and atherosclerotic plaques [10, 11], immunofluorescence tests for diagnosis of toxoplasmosis, prostate cancer, etc. It is concluded due to literature review that laser induced fluorescence spectroscopy is a potential noninvasive diagnostic tool for the differentiation of normal and neoplastic human tissues [12—17].
Fluorescence techniques can take advantage of endogenous fluorophores, widely present in biological tissues, like aromatic acids (tryptophan, tyrosine and phenylalanine, structural proteins (collagen and elas-
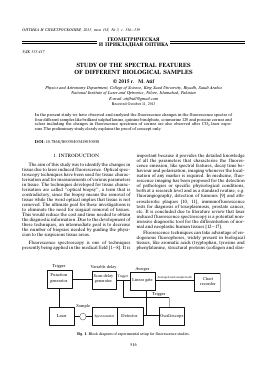
Fig. 1. Block diagram of experimental setup for fluorescence studies.
Fluorescence intensity, arb. un.
80
40
480
520 560
Wavelength, nm
Fig. 2. Brilliant sulphaflanine spectrum.
Fluorescence intensity, arb. un.
80
40
Fluorecscence intensity, arb. un.
80
40
440
480
520
80
40
440 480
Wavelength, nm
520
460 500 540
Wavelength, nm
Fig. 3. Quinine bisulphate spectrum.
tin) or lipopigments (e.g., ceroids and lipofuscin) [18— 28]. Otherwise, they relay on exogenous markers showing well defined fluorescent properties. Examples are fluorescein or indocyanine green, normally used in ophthalmology [29] and in immunofluorescence microscopy [30] and photosensitizers. In the current study the fluorescence spectra of four different samples, e.g., brilliant sulphaflanine, quinine bisulphate, coumarine 120 and porcine cornea and sclera are recorded and analysed. The changes in fluorescence spectrum of cornea are also observed after exposure with CO2 laser.
EXPERIMENTAL SETUP
The experimental setup used to record the fluorescence spectrum of different samples is shown in Fig. 1. The excitation source was pulsed nitrogen. The laser characteristics were wavelength 337 nm, pulse duration 3 ns, frequency 10 Hz. The laser output was fo-
Fig. 4. Fluorescence spectrum of coumarine 120 with (a) and without (b) iris.
cused onto the polystyrene sample cuvette using a fused silica lens of 25 mm focal length. Fluorescent light emitted by the sample was collected by an ordinary glass lens of focal length 50 mm and imaged onto the entrance slit of an visible-ultraviolet (UV) mono-chromator (Bentham, Reading, UK). An iris is also placed between the ordinary glass lens and the entrance slit of Bentham in order to match the /-number of glass lens to /-number of the monochromator. To obtain time integrated spectra the photomultiplier current pulse was passed to an integrating amplifier (~ 10 s time constant) and the output voltage displayed on a CR652 recorder (J.J. Lloyd, Southampton, UK).
RESULTS AND DISCUSSION
In this study we have recorded the fluorescence spectra of four different samples, e.g., brilliant sulphaflanine, quinine bisulphate, coumarine 120 and porcine cornea and sclera. Furthermore, the change in fluorescence spectrum of cornea is also analysed after interaction with CO2 laser. Figure 2 shows the fluorescence spectrum of a dye of brilliant sulphaflanine. The above spectrum is very broad and shows a peak at 525 nm.
0
0
0
0
OnTHKA H CTEKTPOCKOnHH tom 118 № 3 2015
518
ATIF
Fluorescence intensity, arb. un.
80-
40-
0-
440
480 520
Wavelength, nm
Fig. 5. Fluorescence spectrum of porcine cornea.
Fluorescence intensity, arb. un.
80
40
440
480 520
Wavelength, nm
Fig. 6. Fluorescence spectrum of porcine sclera.
Quinine bisulphate was selected to calibrate the experimental setup because it has well defined quantum yield and temperature dependence for 350 nm excitation [27]. The wavelength scale was calibrated against the monochromator counter using a low pressure Hg-lamp. Furthermore, the number of photons reaching at the entrance slit of the monochromator was also calculated for quinine bisulphate, i.e., 1.376 x x 1012 photons. Fluorescence spectrum of quinine bisulphate having a solution concentration of 2 x 10⁻⁵ M is shown in Fig. 3. Fluorescence spectrum of couma-rine 120 in 50:50 methanol: ACN + 0.1% was obtained over a concentration range of 10-5 M. The two spectra show the effect of iris in the sample as clear from Fig. 4. The iris properly fills the diffraction grating of the spectrometer and the spectrum shape becomes sharp. Both the results are in excellent agreement with Allwood et al. [27].
Fluorescence spectroscopy has been performed on porcine cornea and sclera. Following excitation at 337 nm with the light from a nitrogen laser, the tissue autofluorescence from about 440 to 540 nm was detected with a chart recorder attached to the monochromator. Figures 5 and 6 shows the fluorescence spectra of porcine cornea, sclera.
Furthermore, the effect of CO2 laser interaction on the porcine cornea was also observed. The CO2 laser of wavelength 10.6 ^m was used in ultrapulse mode having energy 250 mJ, power 10 W and the sample was exposed for 0.05 s. This sample is illuminated with CO2 laser by increasing the time step by step till the sample was destroyed fully. The effect on the sample was also observed. Figure 7 shows the fluorescence spectrum of porcine cornea irradiated by CO2 laser.
The tissue autofluorescence from about 440 to 540 nm was detected with a chart recorder attached to the monochromator. All the spectra are quite broad. The peaks around 510 nm are observed and these are due to the contribution of flavins and NADH (nico-
Fluorescence intensity, arb. un.
80-
40
0-
450 470 490 510 530
Wavelength, nm
Fig. 7. Fluorescence spectrum of cornea irradiated by CO2 laser.
tinamide adenine dinucleotide) [28]. No change in the fluorescence spectrum of porcine cornea was observed after interaction with CO2 laser. The autofluorescence of tissue provides one of information about its biochemical composition, the cellular metabolism and the architecture of tissue.
With 337 nm excitation light, the major endogenous fluorophores contributing to the emission are NADH (absorption maximum 340 nm) and, to a much less degree, flavins (absorption maximum 450 nm). The observed tissue spectra are due to the superposition of the various fluorophore emissions.
4. CONCLUSION
The reported preliminary study clearly demonstrates the proof of concept from limited samples of the fluorescence spectra showing different peaks be-
0
QnTHKA H CTEKTPQCKQnHH tom 118 № 3 2015
tween 440 to 540 nm which was detected with a chart recorder attached to the monochromator. A peak at 510 nm is observed and it was due to the contribution of flavins and NADH (nicotinamide adenine dinucle-otide) [24]. No effect in the fluorescence spectrum of porcine cornea was observed with CO2 laser irradiation.
Further, we are trying to buy a diffractive lens of size 10—20 mm and focal length 100 mm for our present nitrogen laser experimental setup. That will enhance the capability of our setup. The purpose is to use this lens for multispectral imaging and also utilise it for further extensive studies of biological tissue.
ACKNOWLEDGMENTS
This project was supported by King Saud University, Deanship of Scientific Research, College of Science Research Center.
REFERENCES
1. R. Richards-Kortum and E. Sevick-Muraca, Ann. Rev. Phys. Chem. 47, 555-606 (1996).
2. M. A. Mycek, K. T. Schomacker, and N. S. Nishioka, Gastrointest. Endosc. 48, 390-394 (1998).
3. R. Manoharan, Y. Wang, R.R. Dasari et al., Lasers Life Sci. 6, 217 (1995).
4. J. R. Mourant, J. J. Boyer et al., J. Biomed. Opt. 1, 192-6 (1996).
5. M. Atif, S. Firdous, and M. Nawaz, Las. in Med. Sci. 25, 545-550 (2010).
6. M. Atif, Las. Phys. Lett. 9, 387-393 (2012).
7. M. Atif, J. Phys.: Conf. Ser. 414, 012025 (2013).
8. W. Liu, X. Zhang, K. P. Liu, S. D. Zhang, and Y. X. Duan, Chin. Sci. Bull. 58, 2003-2016 (2013).
9. S. Lam, C. MacAulay, J. C. LeRiche, and B. Palcic, Cancer 89, 2468-73 (2000).
10. J. Baraga, R. P. Rava, M. A. Fitzmaurice, L. L. Tong, P. Taroni,
Для дальнейшего прочтения статьи необходимо приобрести полный текст. Статьи высылаются в формате PDF на указанную при оплате почту. Время доставки составляет менее 10 минут. Стоимость одной статьи — 150 рублей.